
Use the Network Pulse multi-chain explorer to peek into the world of DeFi.
Table of Contents
Introduction
Prepare to explore yet another tool from Blockpour 2.0 to stay on top of multichain DeFi data trends. This edition of Blockpour 2.0 Basics uncovers the Network Pulse page and all of its many features.
Network Pulse curates key statistics to track cryptocurrency activities on and between all the blockchain networks Blockpour. Regular traders may find Network Pulse beneficial as it naturally highlights fresh opportunities across networks, such as arbitrage and nascent trends. Network Pulse is one of the many upgrades from Blockpour 2.0, and reflects the various changes to the UI.
Follow along with this blog and figure out how to utilize all the features of Network Pulse to keep a finger on the heartbeat of the DeFi space.
Make sense of the multi-chain network landscape
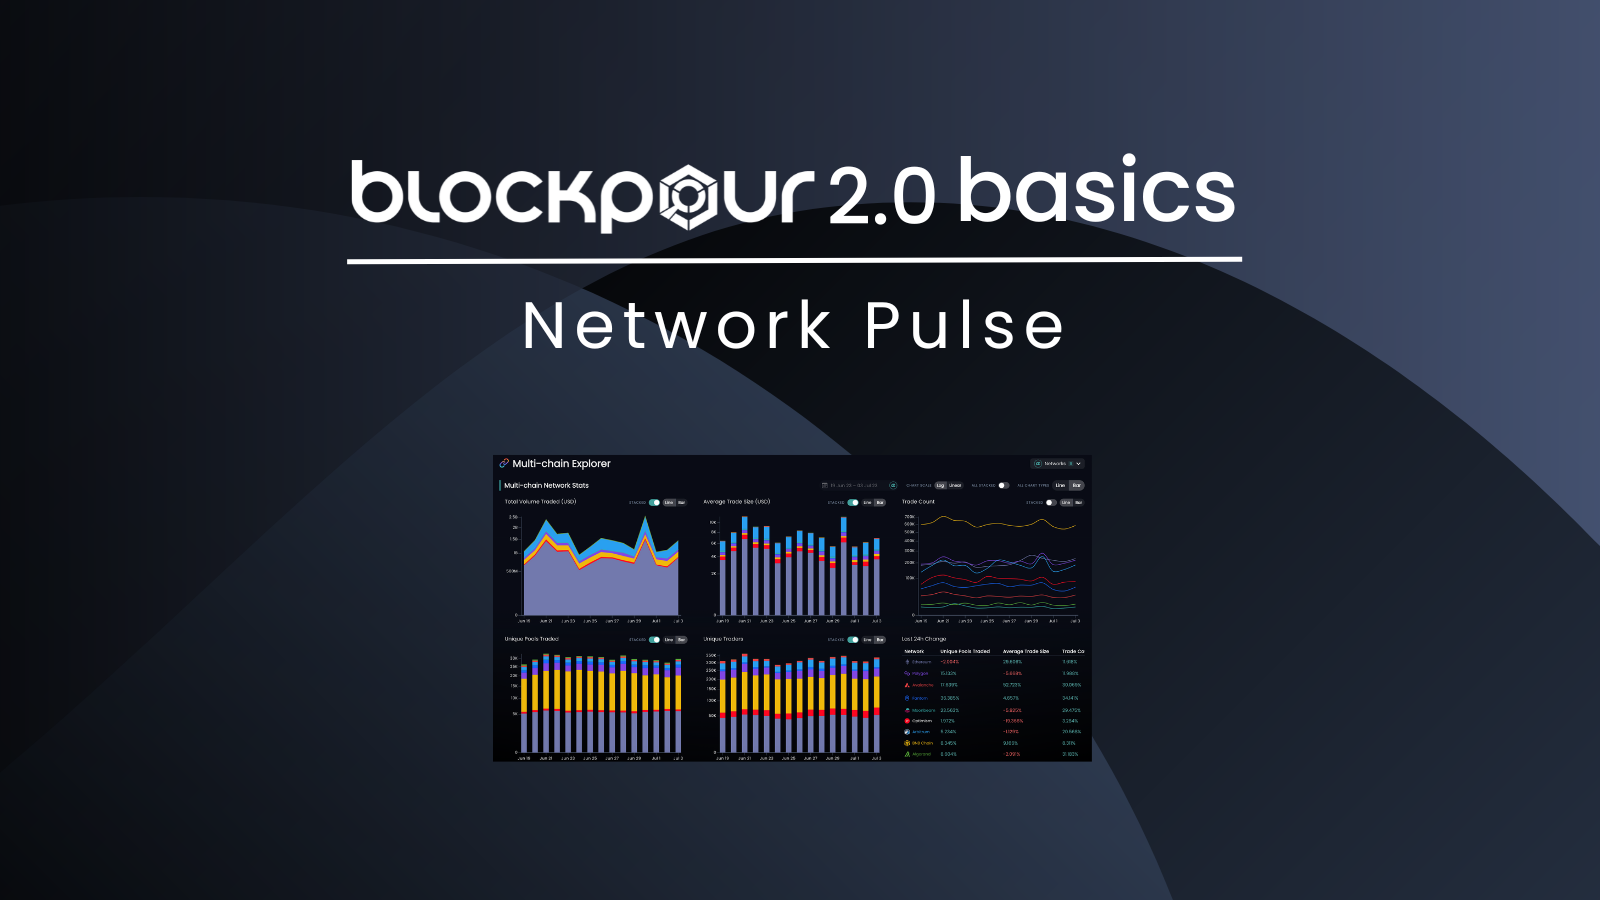
Upon entering the Network Pulse page from the side menu, users are immediately greeted by multi-chain network stats from three separate widgets and filters for the page. From the top right, users can filter date ranges (up to 30-day periods), change chart scale from logarithmic to linear, stacked charts, chart types, and which networks to display. Many of these filter options are designed to allow users to customize the updated UI to their liking.
Other filters, however, maximize the number of viewpoints with which a user can track the multi-chain DeFi ecosystem. Compare stats such as average trade size on all the widgets between the networks filtered for with crystal clarity to determine which network could be the better one onto which to deploy capital.
Compare stats across networks with the Network Pulse tool.
Network Pulse by the widgets
Network Pulse features 13 widgets to provide the view into the multi-chain ecosystem. The widgets in order from left to right, top to bottom of the page are:
- Total Trade Volume (USD)
- Average Trade Size (USD)
- Trade Count
- Unique Liquidity Pools with Trades
- Unique Traders
- Last Day-Over-Day Change
- Highest Trade Count
- Largest Average Trade Size
- Most Pools Traded
- Most Traders
- Largest Volume (USD)
- Network Data Table
- Top Multi-chain Tokens
So, what do each of these DeFi data widgets do?
Critical data from the top three Network Pulse widgets
The first three widgets displayed at the top of Network Pulse are Total Volume Traded (USD), Average Trade Size (USD), and Trade Count. These three can be individually adjusted to be stacked or to display as line or bar charts.
Like other sections of Blockpour 2.0, network data on each widget is color coded to correspond with each network’s most prominent colors, ie. lavender for Ethereum, light blue for Arbitrum, dark blue for Fantom, etc.
The Total Trade Volume (USD) widget displays the total value in USD traded on a given network over a calendar day. This is data from all tokens traded on all tracked DEXes on a network.
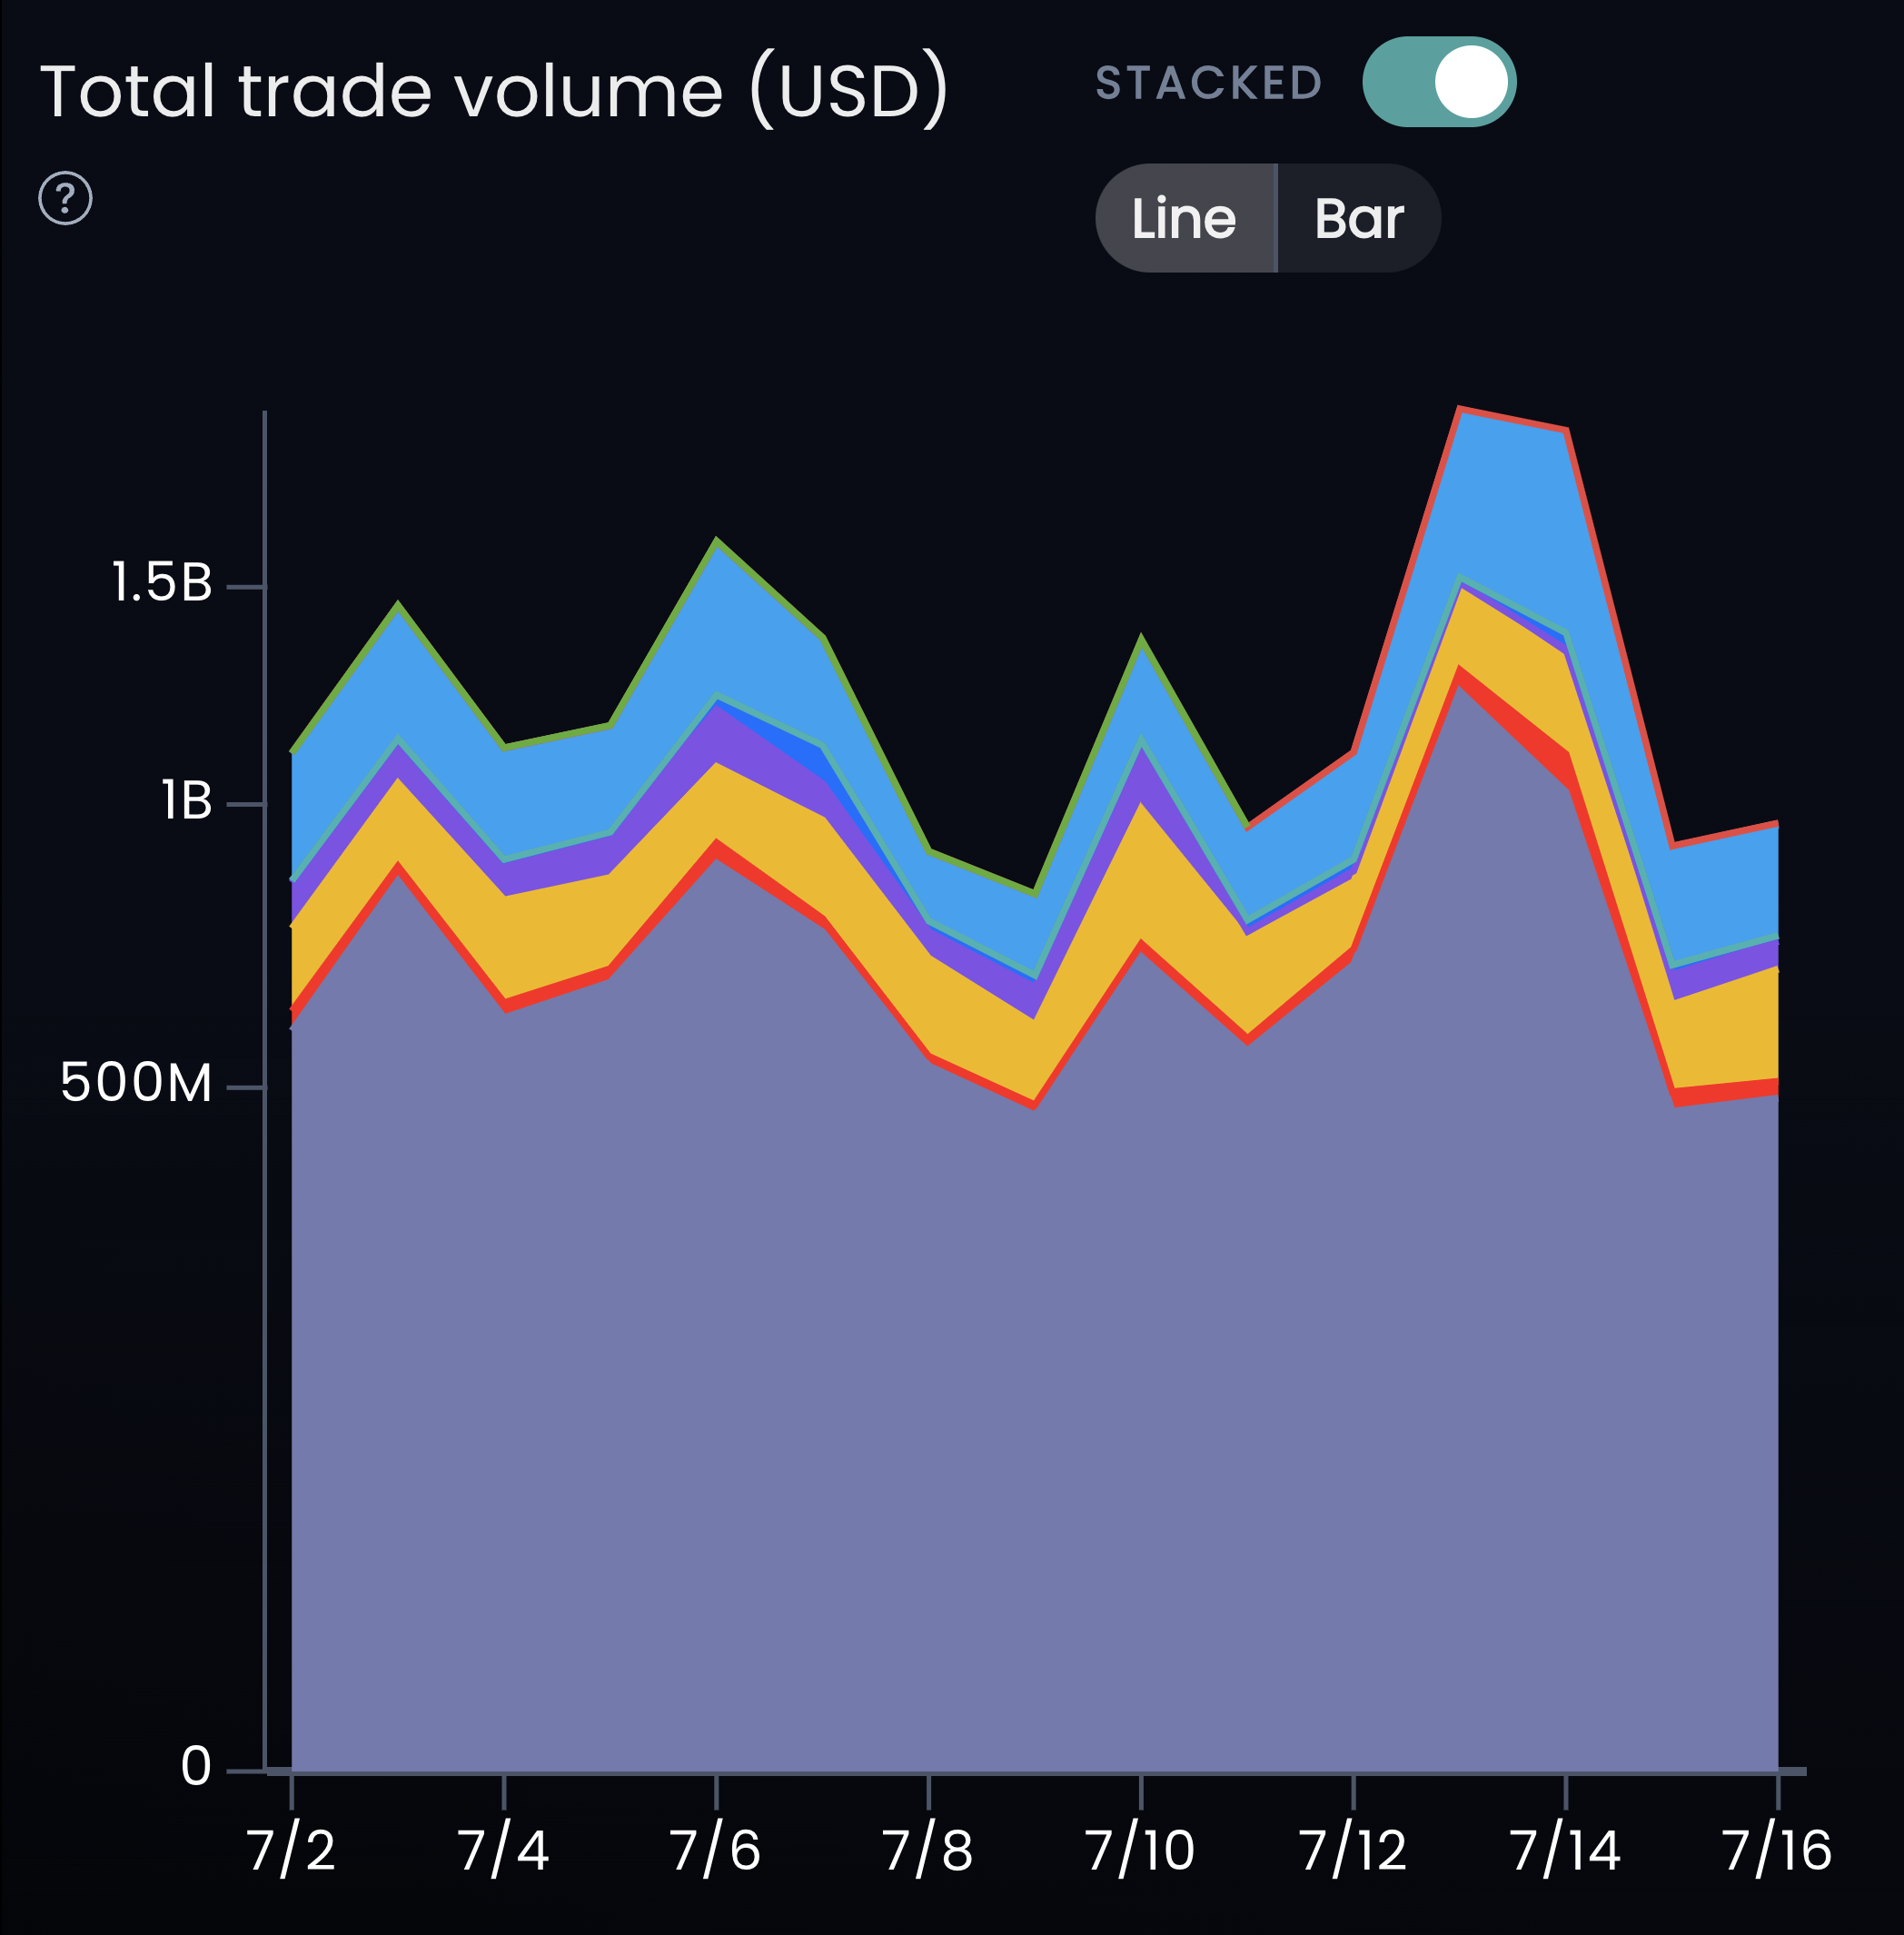
The Total Trade Volume (USD) widget on Blockpour's Network Pulse.
Scrolling over these widgets will bring up specific numbers on each network. For example, scrolling over the Ethereum section of the Total Volume Traded (USD) widget unfurls the exact amount of volume facilitated on the network for a particular day. This functionality applies to the top three widgets in this subsection, and the first two in the next subsection.
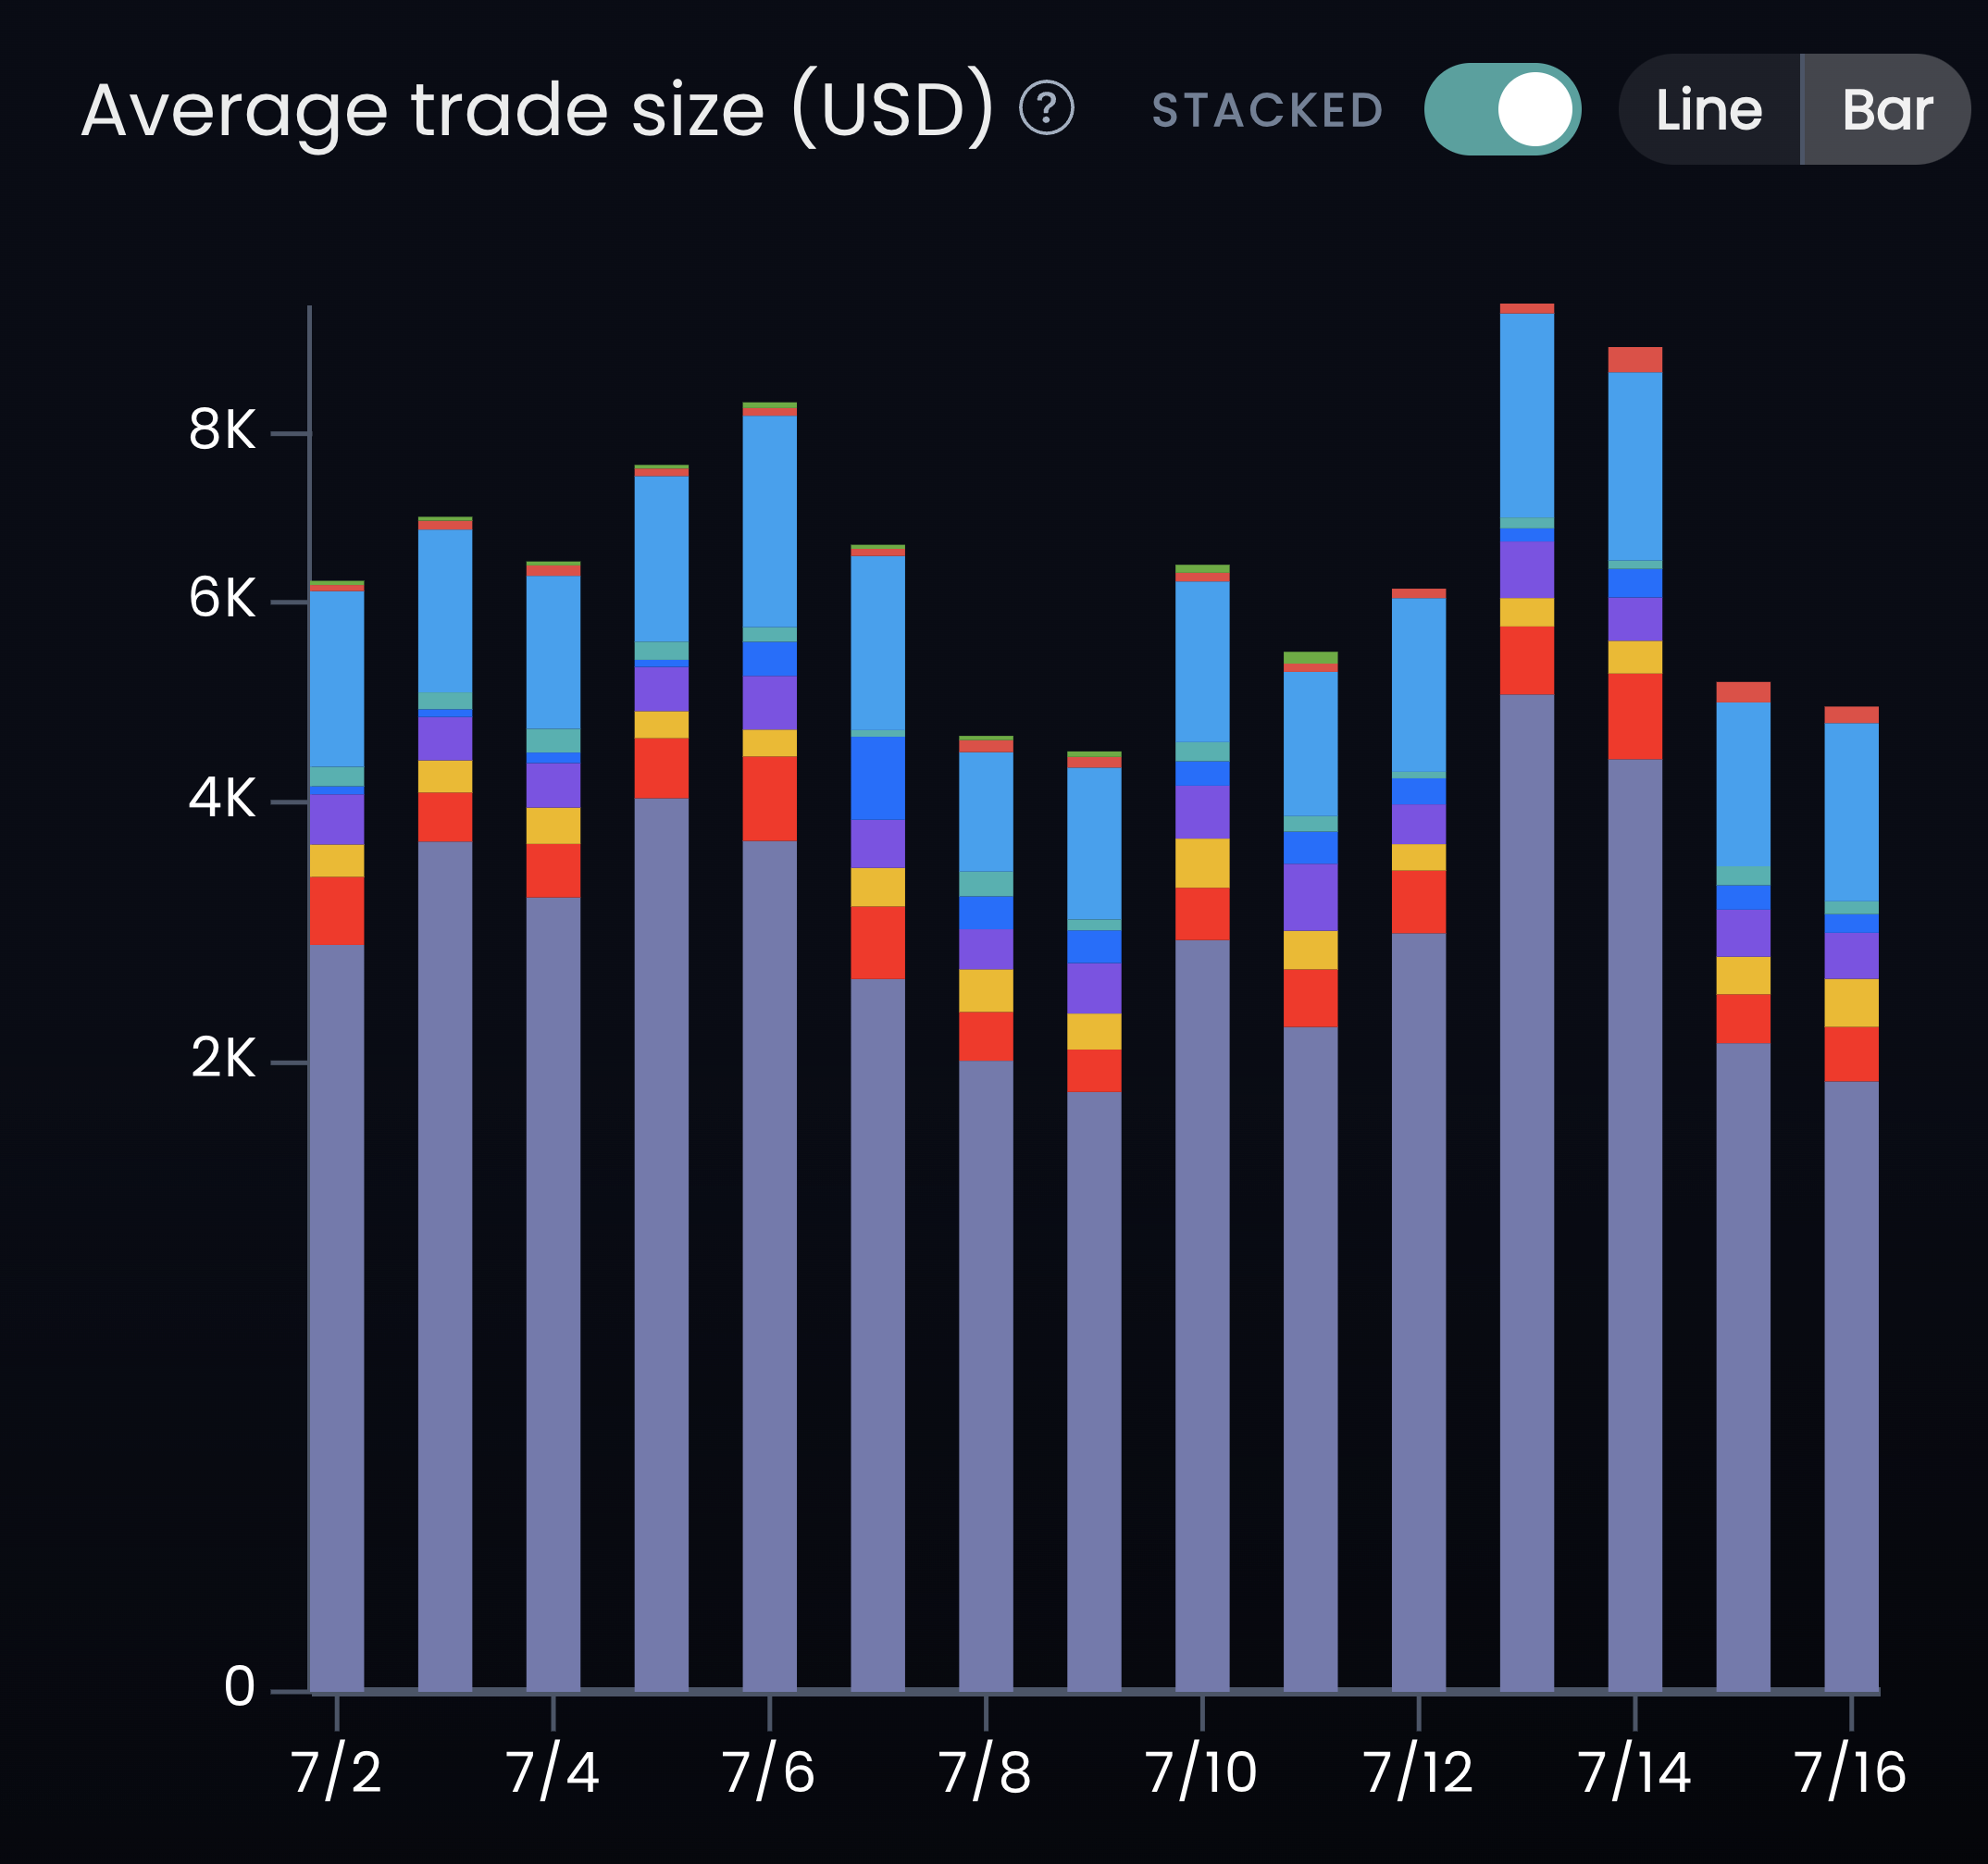
The Average Trade Size (USD) widget.
The Average Trade Size (USD) widget shows the USD value of the average trade on a network. The Trade Count widget shows the total number of trades facilitated on a network over a calendar day. It also completes the triumvirate of key critical network stats. When combined, this data can provide strong implications about general network activity and how capital is moving.
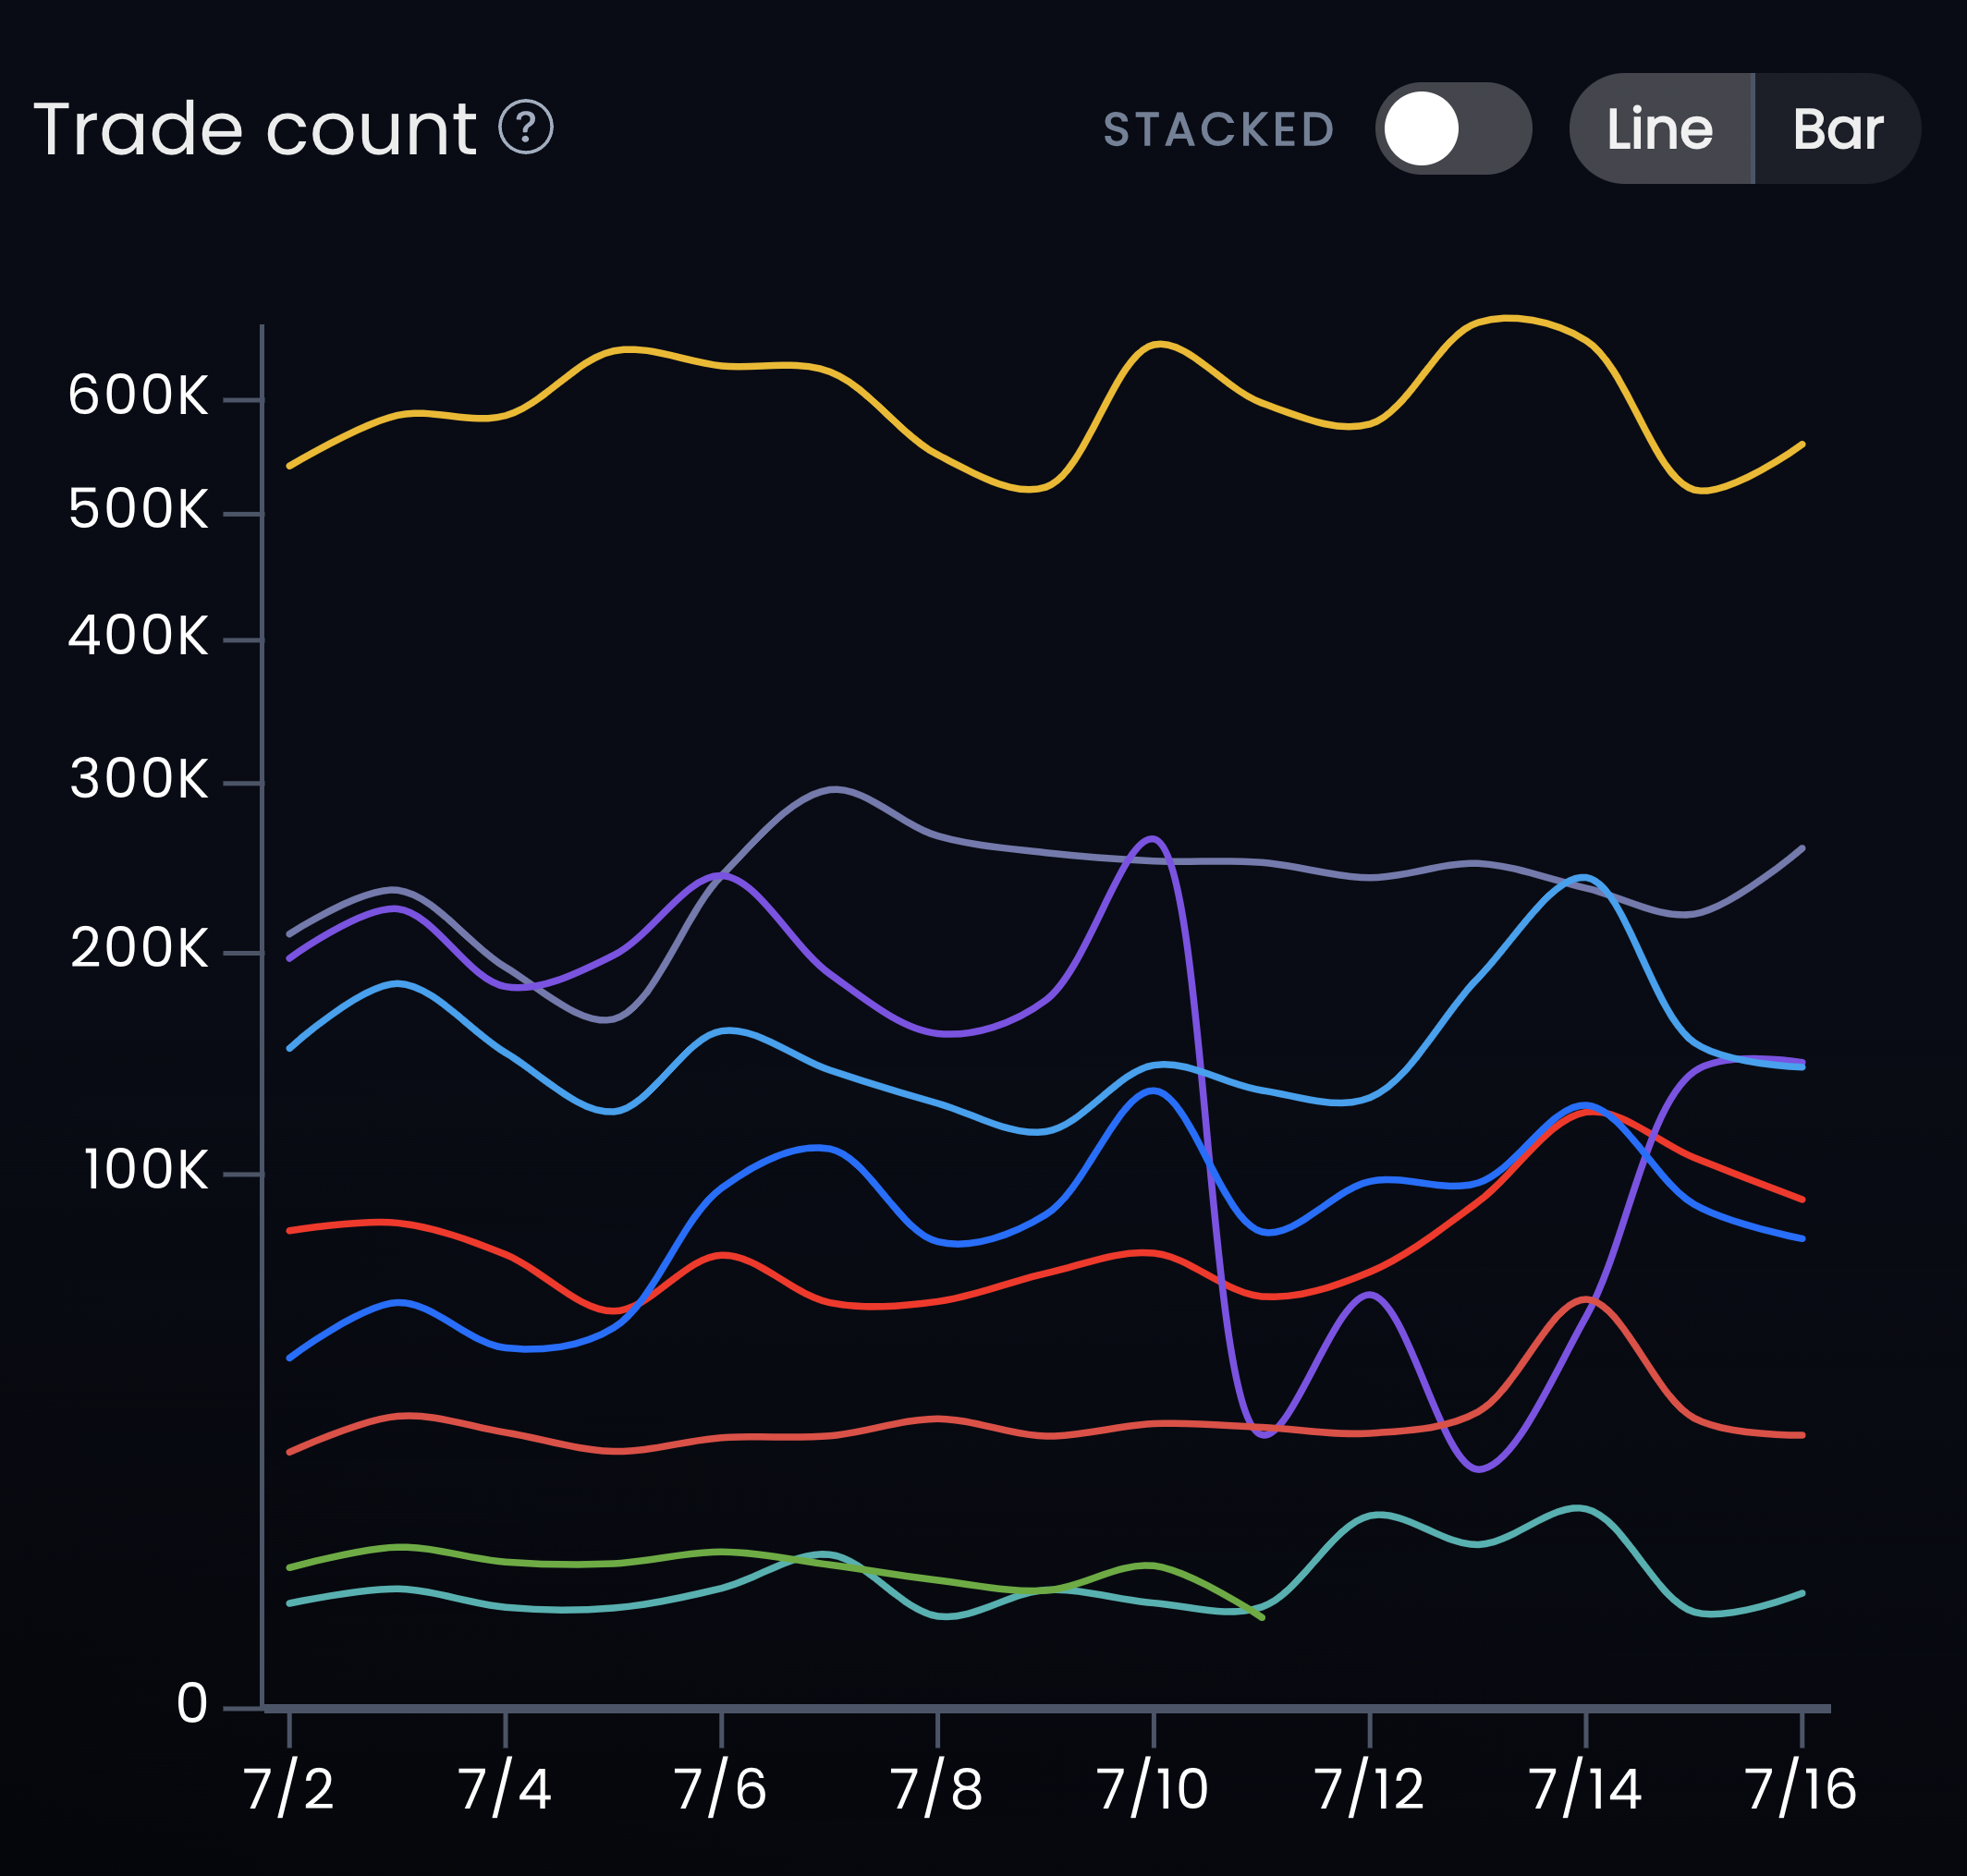
Viewing network trade counts on Blockpour.
Other key Network Pulse widgets
Another set of three widgets sits just below the top three.
Gain valuable insights about the general activity on DEXes across networks with the Unique Liquidity Pools with Trades widget. The more pools, the more activity. More activity suggests a greater number of opportunities on a network.
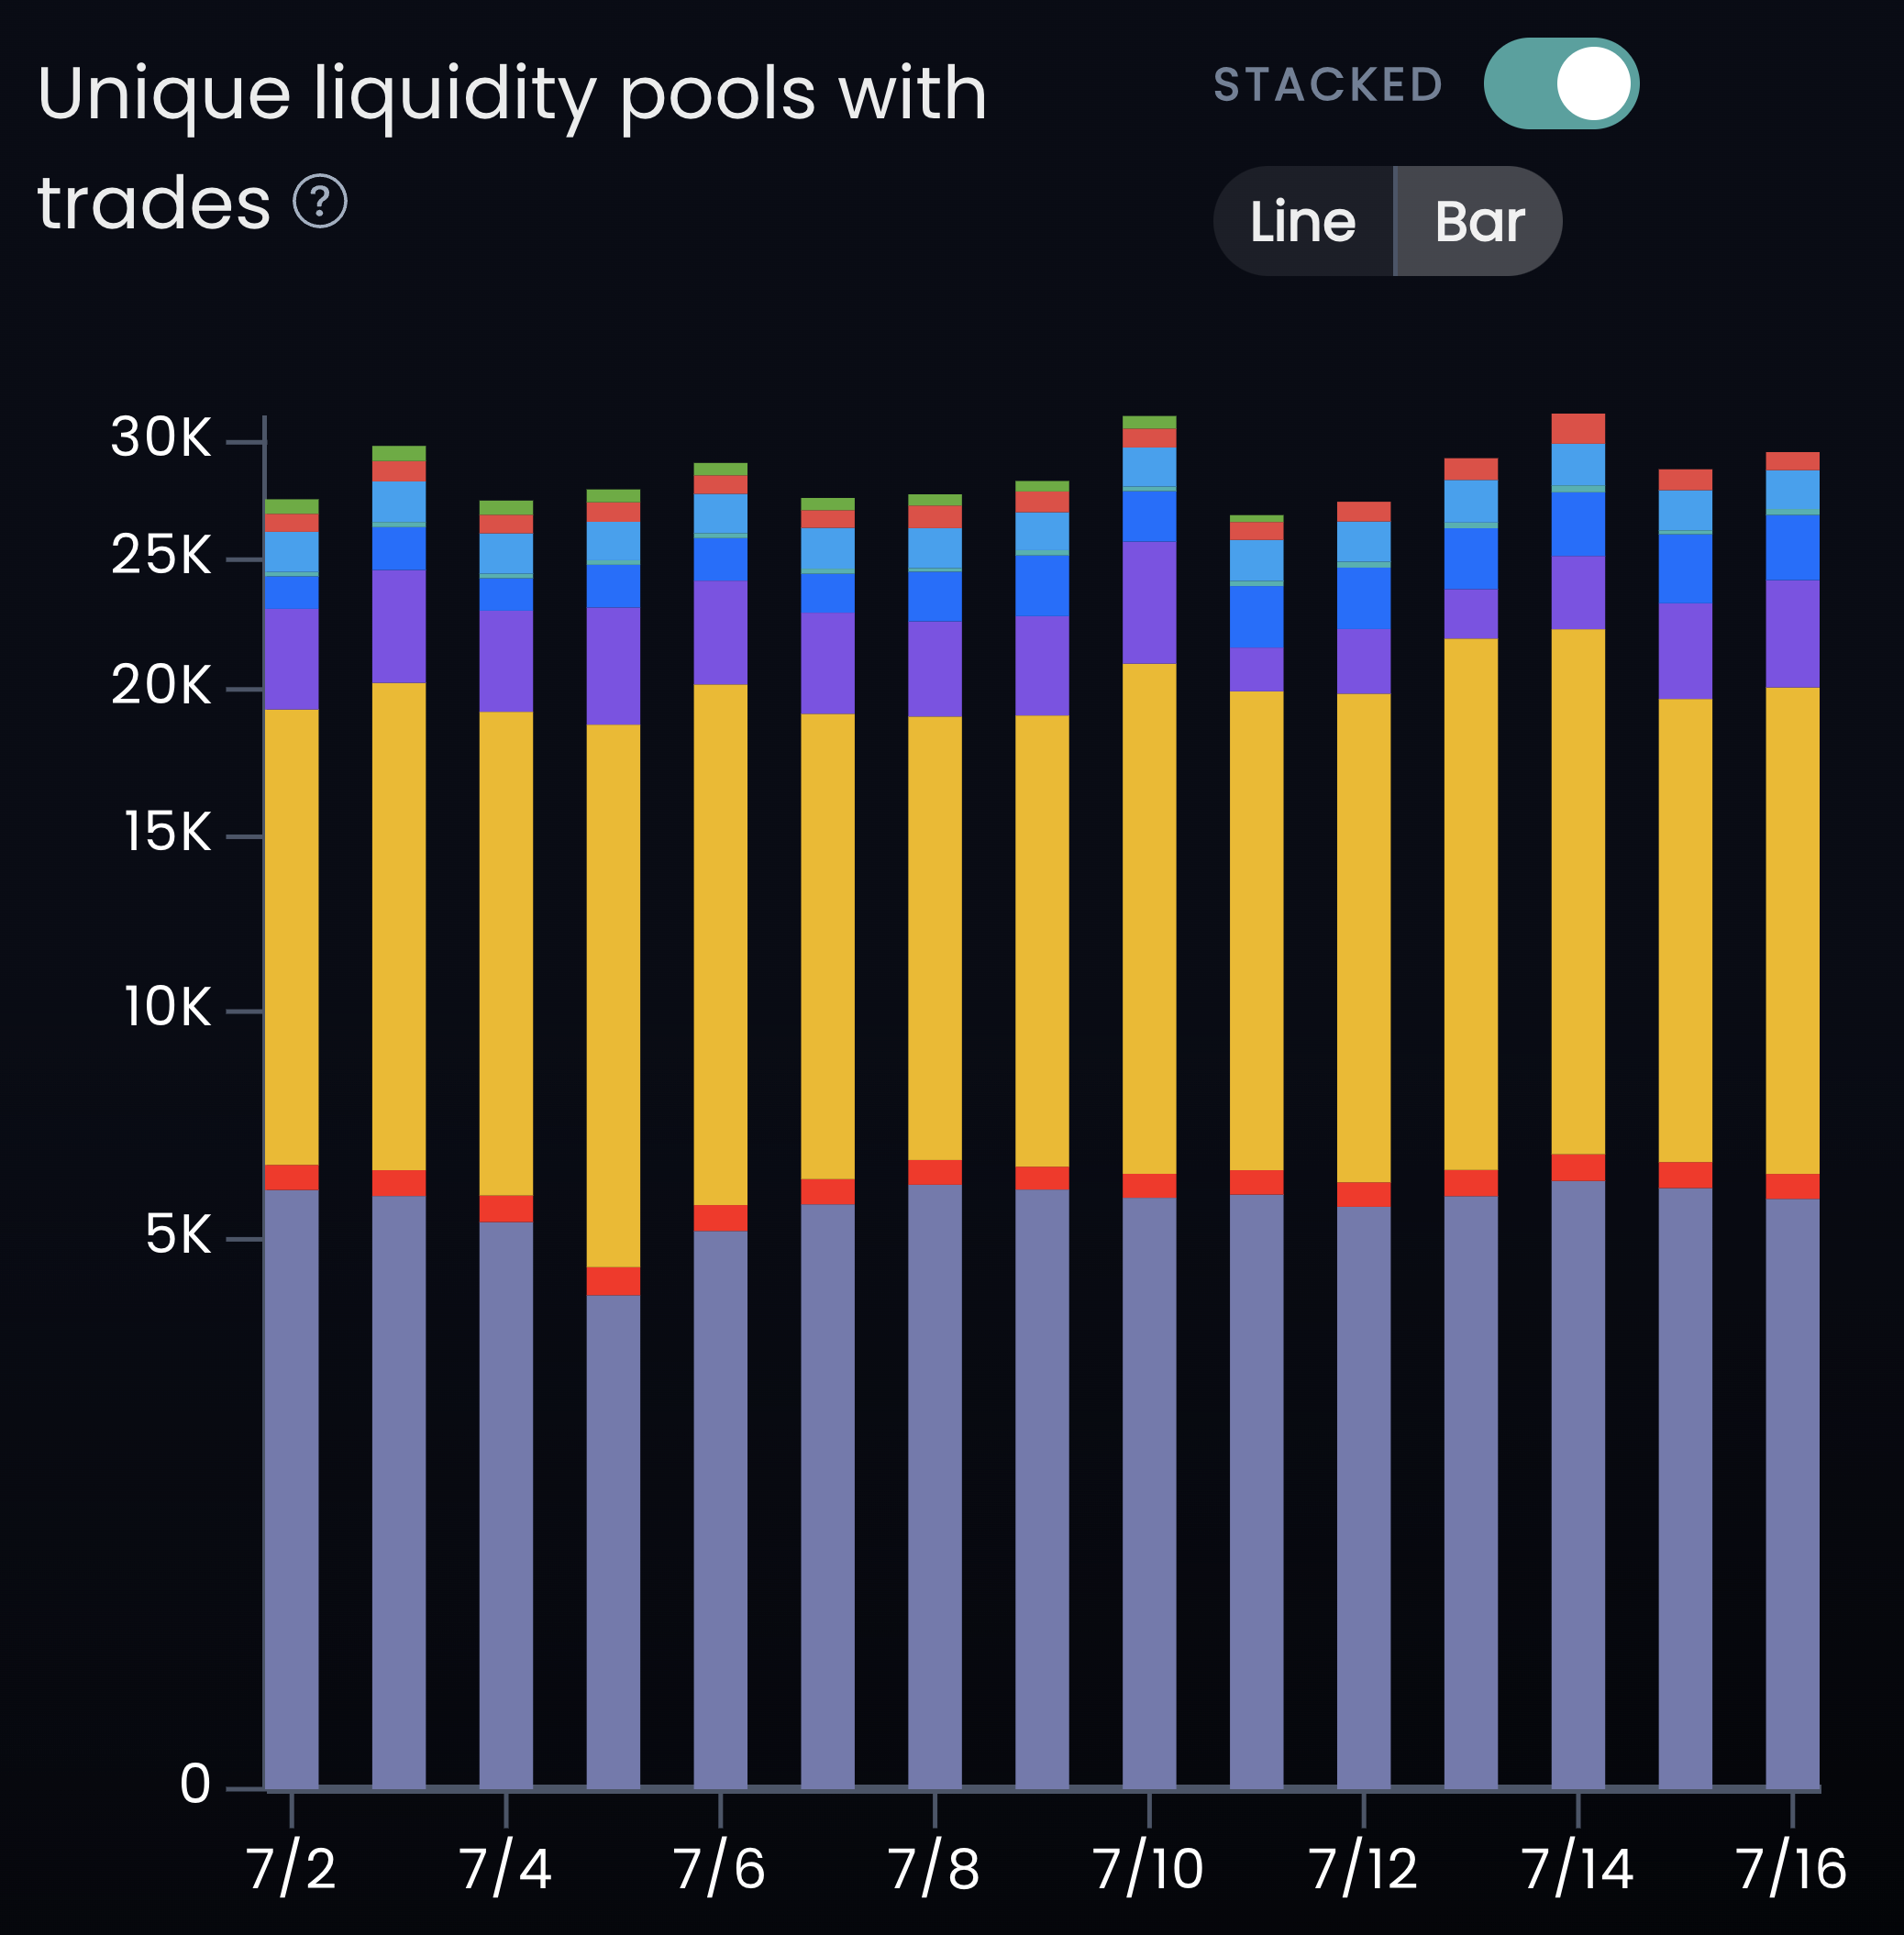
View the most active networks with the the Unique Liquidity Pools with Trades widget on Network Pulse.
In addition, the Unique Traders widget will show users just how many wallets have interacted with a DEX to trade over a calendar day. Where there’s smoke, there’s fire. And where there are more traders, there are usually more opportunities.
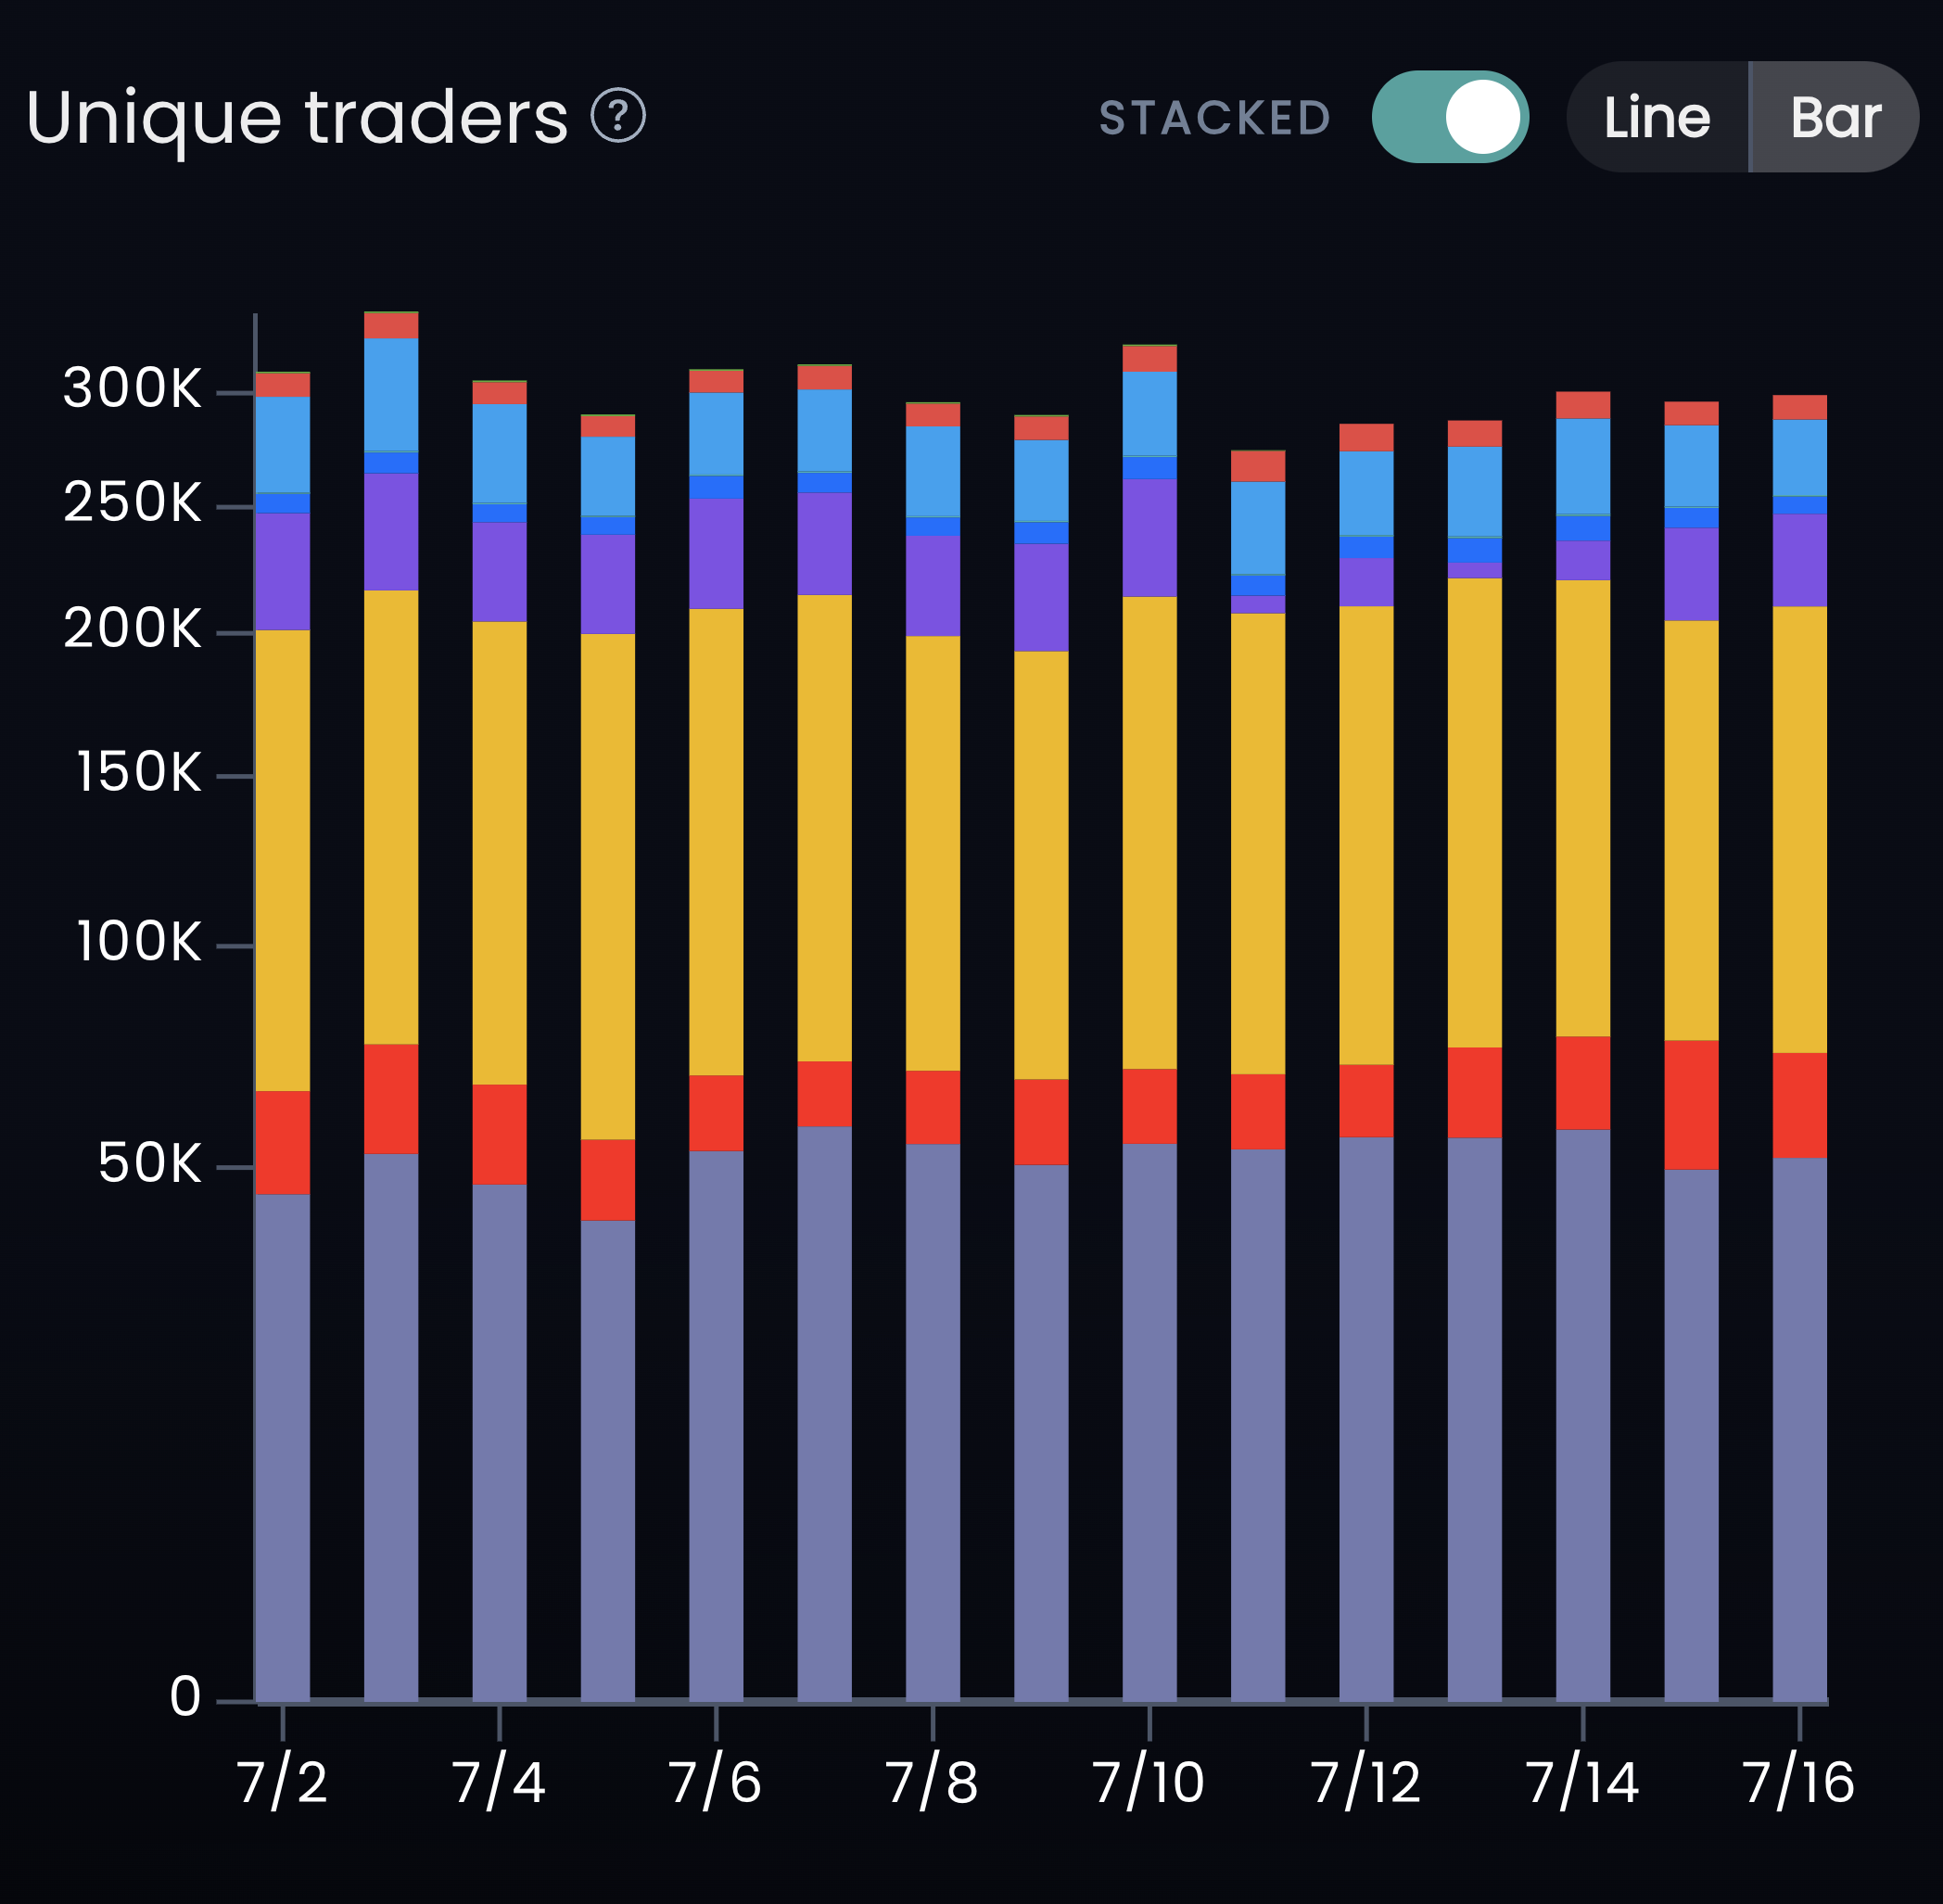
The Unique Traders widget comparing Ethereum, Polygon, Arbitrum, and Optimism.
Finally, the Last Day-Over-Day widget shows a compact data table that shares all the data from Network Pulse for all networks on a single scrollable table. The fully expanded table can also be found further down below the Yesterday’s Snapshot widgets.
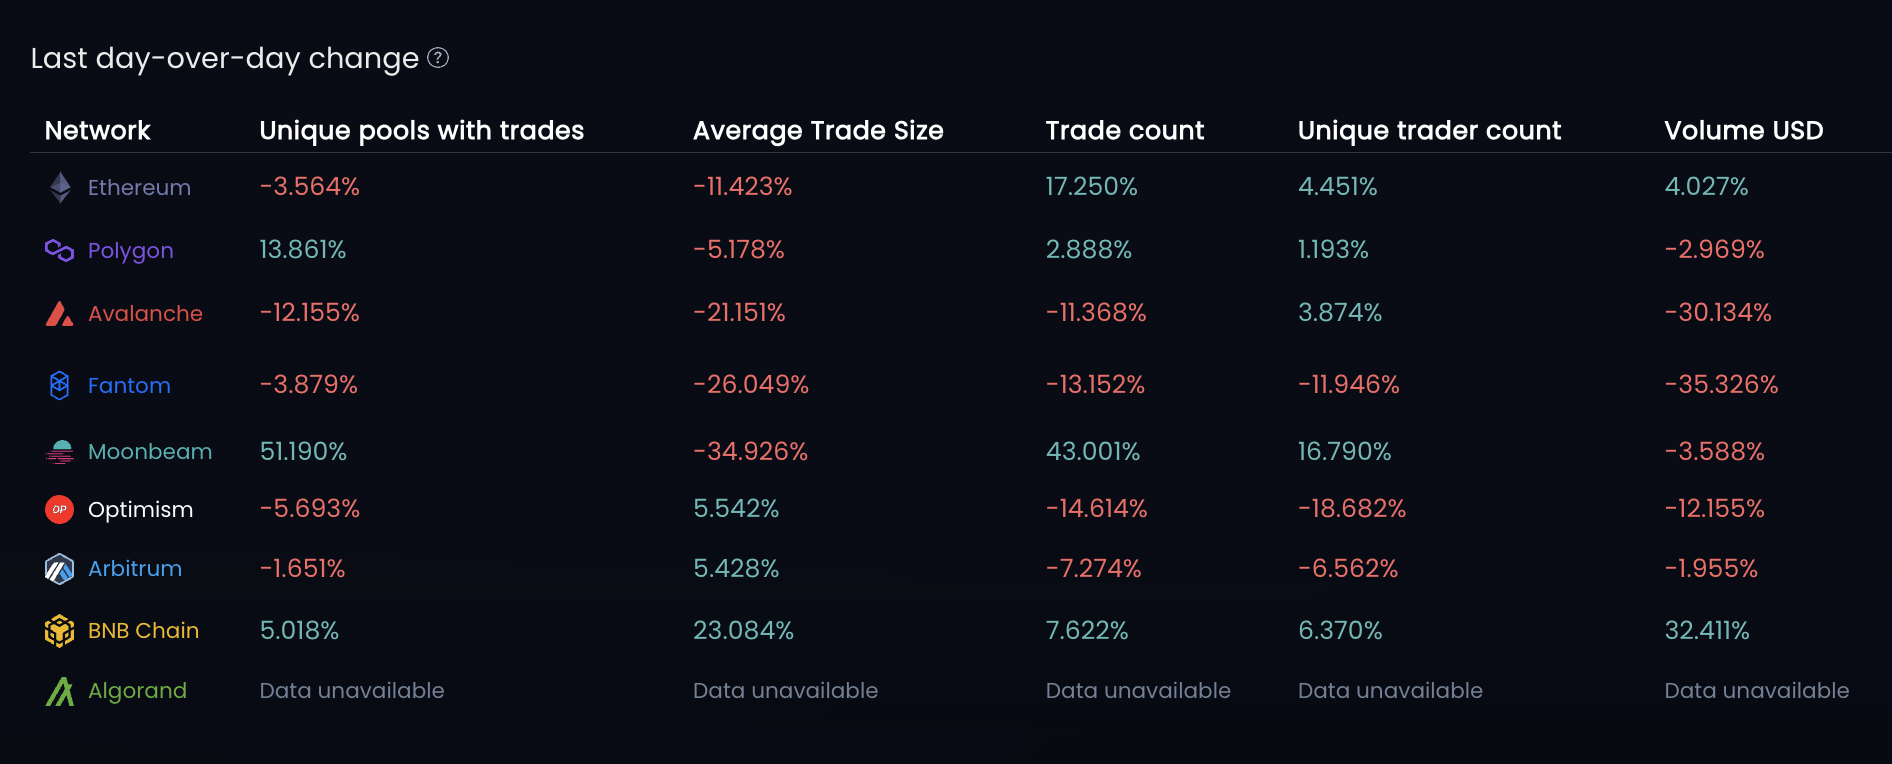
The Last Day-Over-Day Change widget shows short-term changes in the multi-chain ecosystem.
Get Yesterday’s Snapshot on Network Pulse
As previously mentioned, the Yesterday’s Snapshot section contains five different small widgets, hence why it is just a snapshot. This section can be used to gauge recent network activity at a glance rather than needing to delve deeper into long date ranges. View the entire section in the image below. Consider this your front page to DeFi.
When all networks are in view, the network with the top values for each data point will be displayed in the mini-widgets. All values are tracked each calendar day.
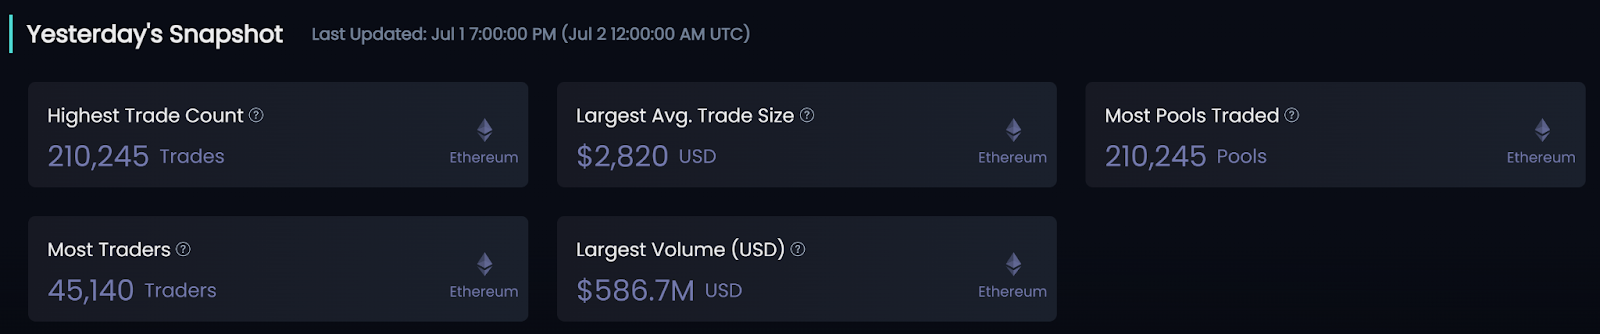
View blockchain network stats with the Yesterday's Snapshot mini-widgets.
The Highest Trade Count widget shows which network had the most trades on tracked DEXes. Largest Average Trade Size shows which network had the highest average trade size, which is determined by the total trade count and trading volume, both of which can also be viewed on Blockpour!
View which network facilitated the most liquidity pools used with the Most Pools Traded mini-widget. Also, Most Traders shows which network housed the most trades from all wallets aggregated. Finally, view which network facilitated the most trading volume on Largest Volume (USD).
Have you read the snapshot yet today?
For the visual learners: Top Multi-chain Tokens
The Network Pulse tool closes out with another stunning full-width chart that displays the top trending tokens on each network filtered for. The Top Multi-chain Tokens widget is an alpha-packed widget that shows users what total-network trends are in play based on the number of active trades over a specified date range.
The top tokens on each network displayed will show the percent change in price over the last 24 hours. Scrolling over a square will unfurl more data about the token such as what network it’s on, average price, different types of volume, pairs traded on, trade count, and unique traders of that token.
Also, clicking on a square sends users directly to the token’s Token Dashboard to find more details about it.
Easily view Top Multi-chain Tokens on Blockpour's Network Pulse.
Locate the alpha on Network Pulse
Network Pulse is one of the more versatile new offerings on Blockpour 2.0, all of which can be accessed with an Alpha Pro subscription, as it can be used to provide a quick overview of networks, or can be the primary starting point for research efforts.
Comparing several stats such as trading volume, unique traders, and pools traded on to a network such as BNB Chain, which is a perennial leader in several metrics, can be a good place to start for some. Comparing one network’s activity, such as Arbitrum, to the tremendous activity on BNB Chain can reveal Arbitrum’s short-term or mid-term performance implications.
Users can answer the important market questions, such as whether they should bridge funds to a suddenly trending network to trade a suddenly trending token, or if it is just a flash in the pan. Network Pulse grants a big-picture perspective that allows users to holistically view the multi-chain landscape, and evaluate trading opportunities across networks.
Also, users who have narrowed down their research efforts to focus on just two networks as part of their short term strategy will find that the Network Pulse UI and functionality provides a critical perspective on the markets. At a glance, compare fluctuations in trade size, trade count, and other key metrics between networks, and determine which network appears to be the healthier, more robust, and more lucrative one for trading.
Conclusion
Network Pulse is a highly robust and versatile tool that adds to the complexity and utility of Blockpour 2.0. Users, and especially subscribers who have full access to all the filters, will immediately discover that Network Pulse is an indispensable piece of their research and alpha discovery process. Get online today and find your alpha using Network Pulse!
About Blockpour
Blockpour is a technology firm specializing in Web3 data and analytics, offering individuals and businesses indispensable data and tools to navigate the dynamic on-chain universe while bridging seamlessly to the off-chain world.
Through our real-time and historical multi-chain data feeds, businesses and traders can fully unlock the power of blockchain data to inform their strategies, optimize operational efficiency, and drive top-line growth.
To learn more about Blockpour check out our website and follow us on Twitter or LinkedIn. For sales or inquiries about the API, contact [email protected].
Disclaimer:
The above article is for informational purposes only and is not financial advice. Blockpour is a data aggregation and analytics platform only and does not provide financial advice or services of any kind.


