

Introducing the updated homepage UI on Blockpour
Table of Contents
This installment of Blockpour Basics introduces the updated homepage UI on Blockpour 2.0. one of many of the major upgrades made to the Blockpour Web3 data platform. The changes amount to massive facelifts on existing tools and a collection of advanced metrics, many of which are available through our newly launched Alpha Pro subscription!
In introducing Blockpour 2.0, we will discuss how to navigate through the new updated homepage UI so users can discover their alpha with more on-chain DeFi trading data than ever before. It now features a wide array of new widgets which users can now customize by appearance and order on the page. This is an exciting evolution for Blockpour, so let us give you all the details over the course of the next several Blockpour Basics blogs!
Navigating the new customizable homepage
Visitors to the Blockpour app homepage will notice the changes right away. There are far more individual widgets than ever before. Let’s get started explaining how to use each of them.
Exploring the updated Blockpour navigation menu
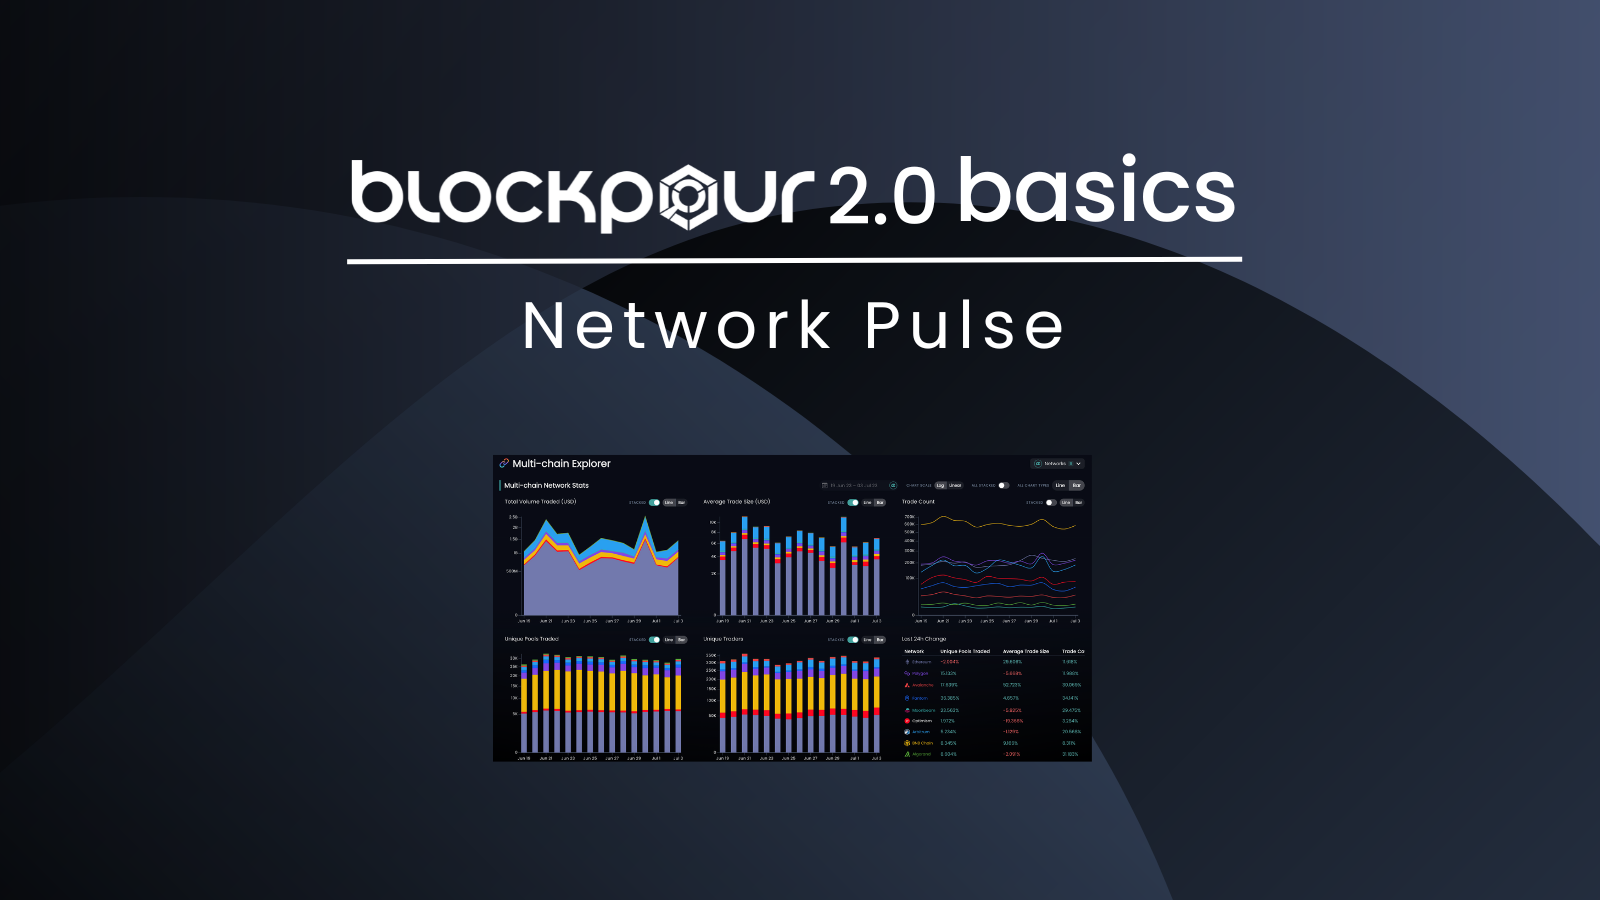
Starting from the left side menu, many of the elements will feel familiar to long-term users. The menu expands when scrolled over and can be locked open. A key change is that now data can be filtered by individual blockchain networks on the homepage by clicking the Networks drop-down menu and choosing the network you want. Furthermore, for those seeking a comprehensive overview of on-chain metrics occurring across multiple networks, Blockpour offers Network Pulse multi-chain explorer that enables users to delve into aggregated multi-chain network statistics.
The Network Pulse multi-chain explorer in action.
How to search for tokens
The search bar at the top left can be opened by clicking it or by typing [ctrl] - [k]. Users can search tokens by multichain or individual network views.
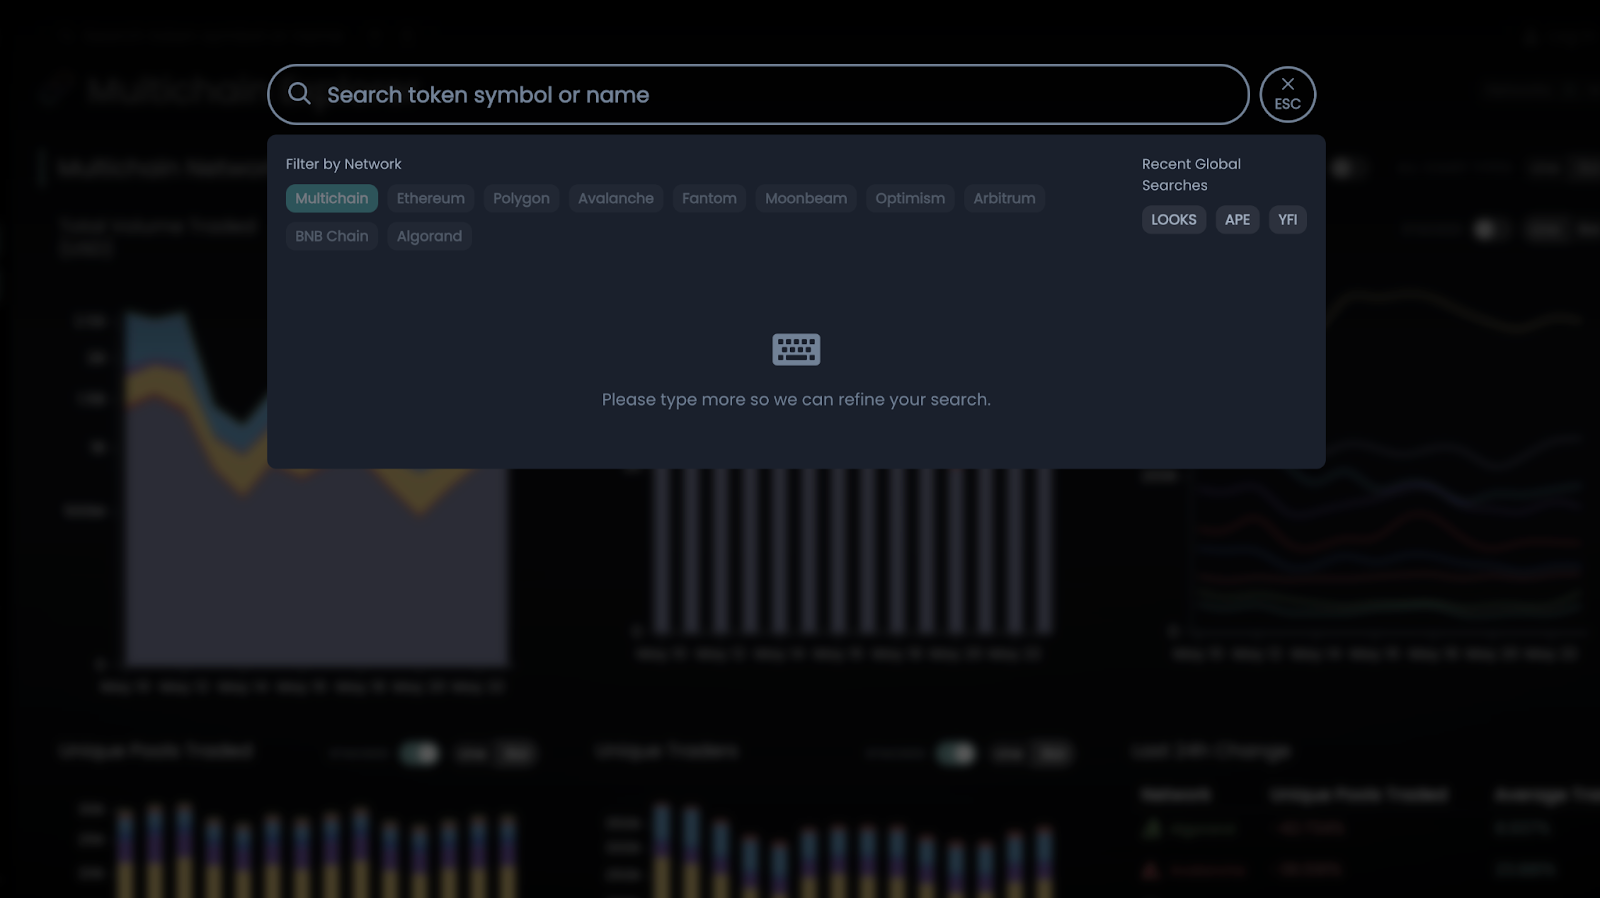
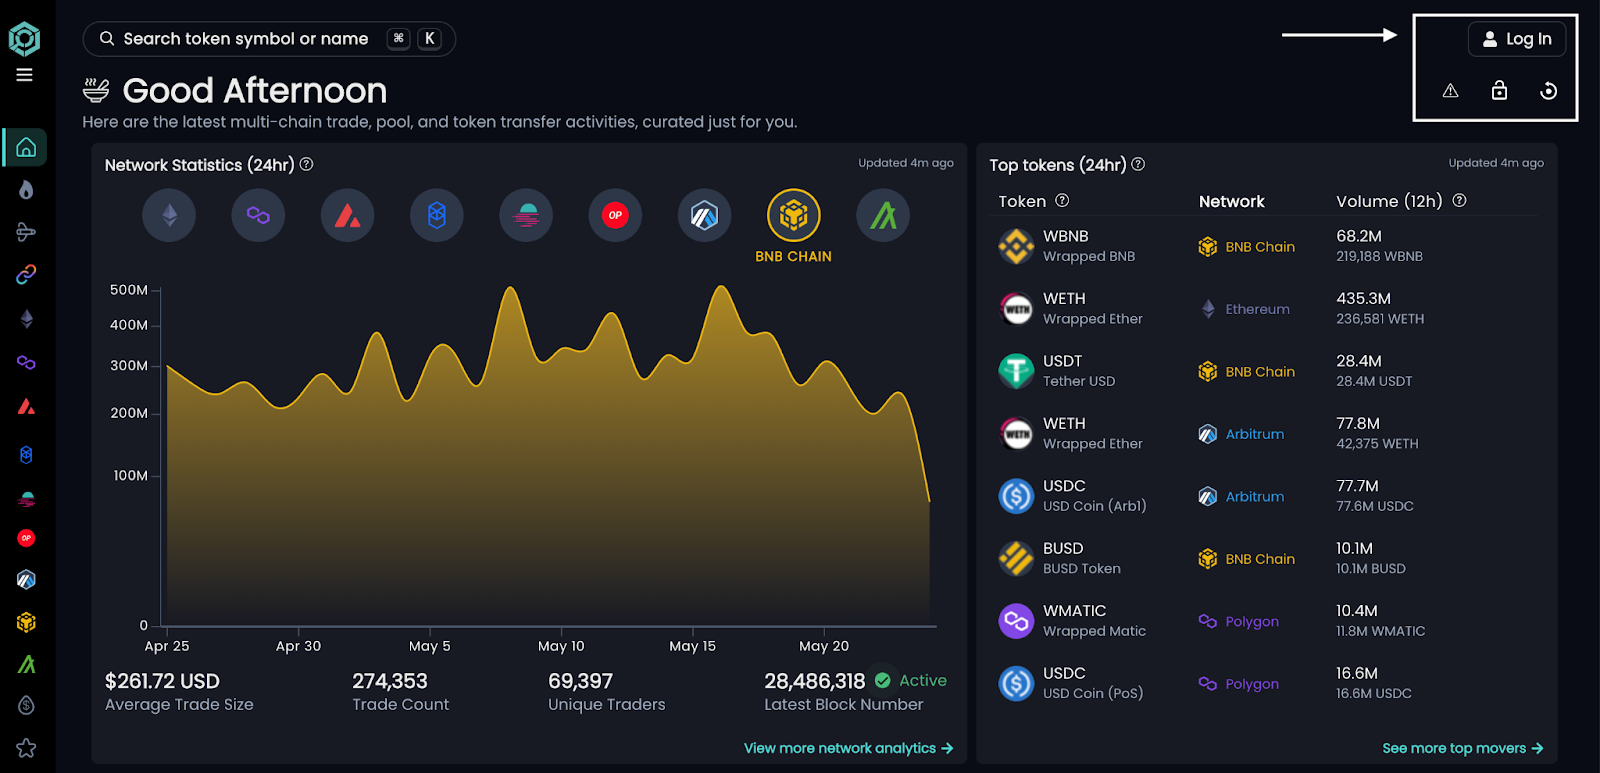
Find the Blockpour search bar at the top left of the app.
Customize the homepage layout
Next, we will introduce each of the widgets now available on the homepage.
The homepage now contains the following widgets:
- Network statistics
- Top tokens by DEX volume
- Highest trade count
- Highest average trade value
- Most unique liquidity pools with trades
- Highest trade volume
- Most unique traders
- Largest liquidity pool activities
- Top liquidity pools by volume
- Top on-chain stablecoin transfer volume
- Top stablecoin by transfer count
- Largest stablecoin inflows/outflows
- Largest stablecoin outflows from entities
- Network trade count
- Most traded tokens
The position and size of all of these widgets can be adjusted by users by unlocking the layout and scrolling over a widget.
Begin customizing your homepage widgets by logging into Blockpour.
Adjusting widgets
At the top right, there are four buttons which allow users to log in to their account for API access, lock or unlock their customizable homepage, and reset the layout to the default. Users can click the lock button on the top right of the app homepage to customize each widget.
After unlocking, simply click and drag a widget then drop it in the desired spot on the homepage. Most widget will also have a white arrow at the bottom right corner, which can be clicked and dragged to adjust its size.
- 1. Locate the lock button at the top right of the app homepage.
- 2. Click the lock button to unlock the widget.
- 3. Once the widgets are unlocked, click and drag a widget to move it.
- 4. Drop the widget in the desired spot on the homepage.
- 5. Look for a white arrow at the bottom right corner of the widget.
- 6. Click and drag the white arrow to adjust the widget's size.
- 7. Click the lock button at the top right to lock your settings.
By customizing their homepage, users can extract alpha from the data Blockpour offers in ways never previously imagined. Whether users want to focus on stablecoins, liquidity pools, CEX token transfers, or whole-market effects, they can find it on the new Blockpour 2.0 UI.
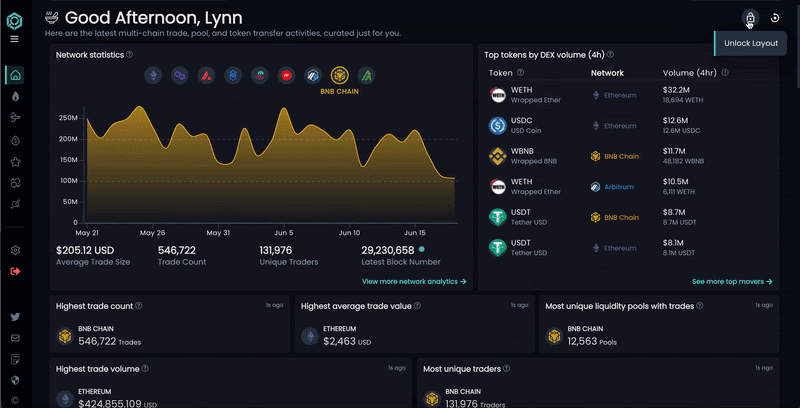
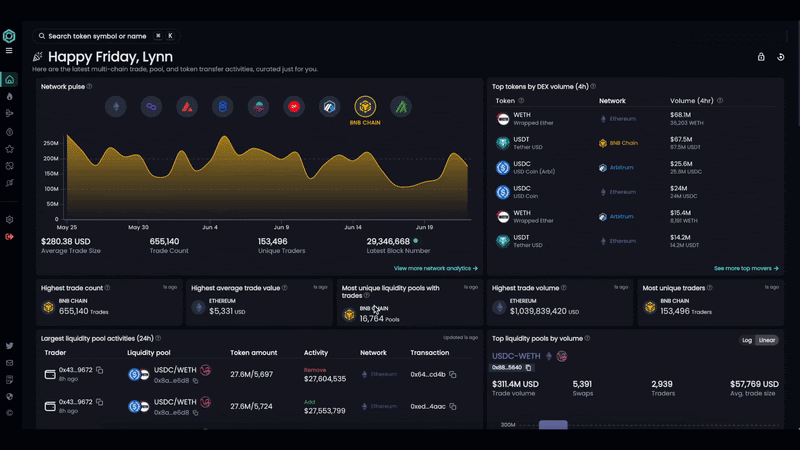
Good Afternoon, Lynn! Make all the adjustments you need to your homepage widgets.
Network statistics
The network statistics widget displays 30 days of data for each blockchain network Blockpour tracks. Users can click on each blockchain network’s logo to display its data in the widget. Here users will find a trading volume chart, 30 day average trade size, trade count, number of unique traders, and the latest block number. The data can be used to track and highlight important shifts in network activity, encouraging users to continue diving deeper on Blockpour to seek additional information about why there have been such shifts.
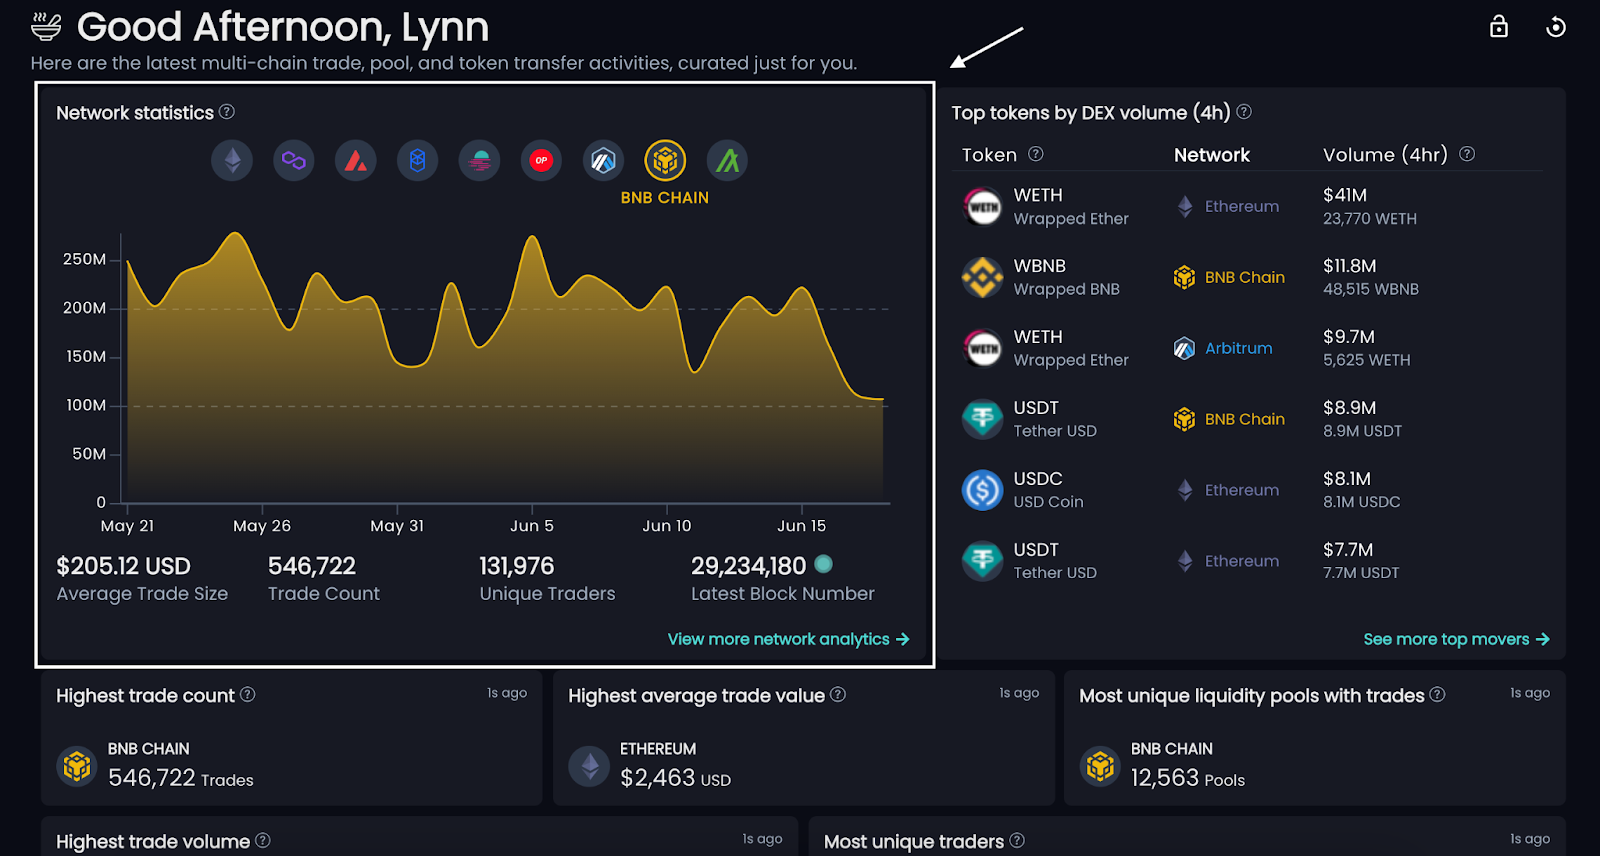
The network statistics widget.
Top tokens by DEX volume
The top tokens by DEX volume widget shows the tokens with the highest volume over the past 12 hours and which network they are on. Some tokens may be displayed multiple times if they are trending on different networks. Clicking on a token’s row in the widget will take users to its token dashboard. This feature aids traders in spotting trending tokens swiftly, enabling them to react quickly to market dynamics and identify potential investment opportunities.
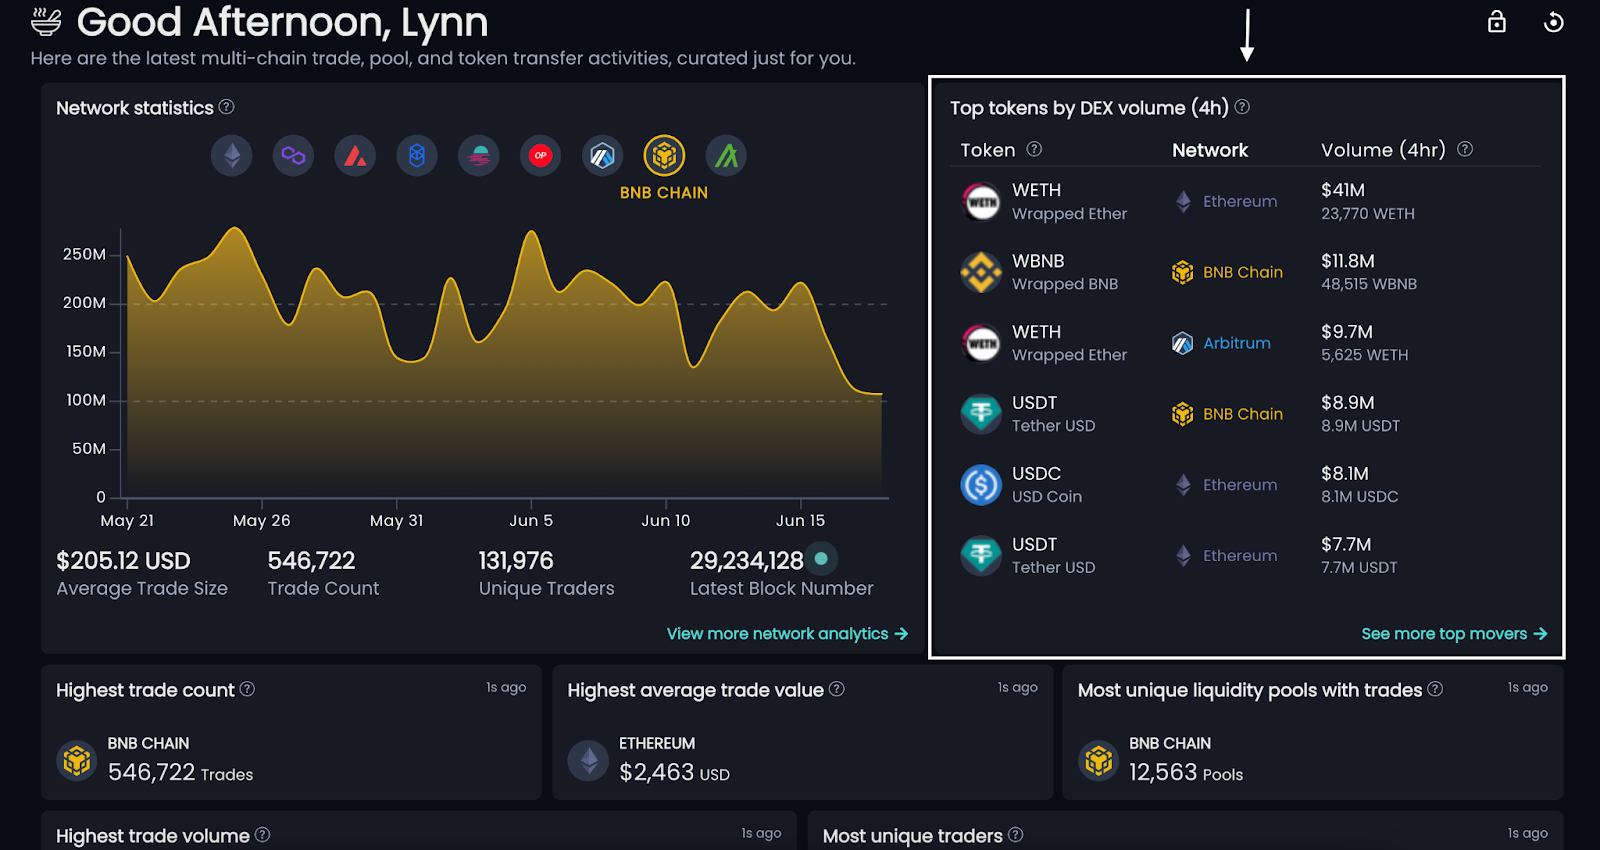
The top tokens by DEX volume widget.
Trending network stats
The following widgets display a single data point sorted by network or token respectively: highest trade count, highest average trade value, most unique liquidity pools with trades, highest trade volume, most unique traders.
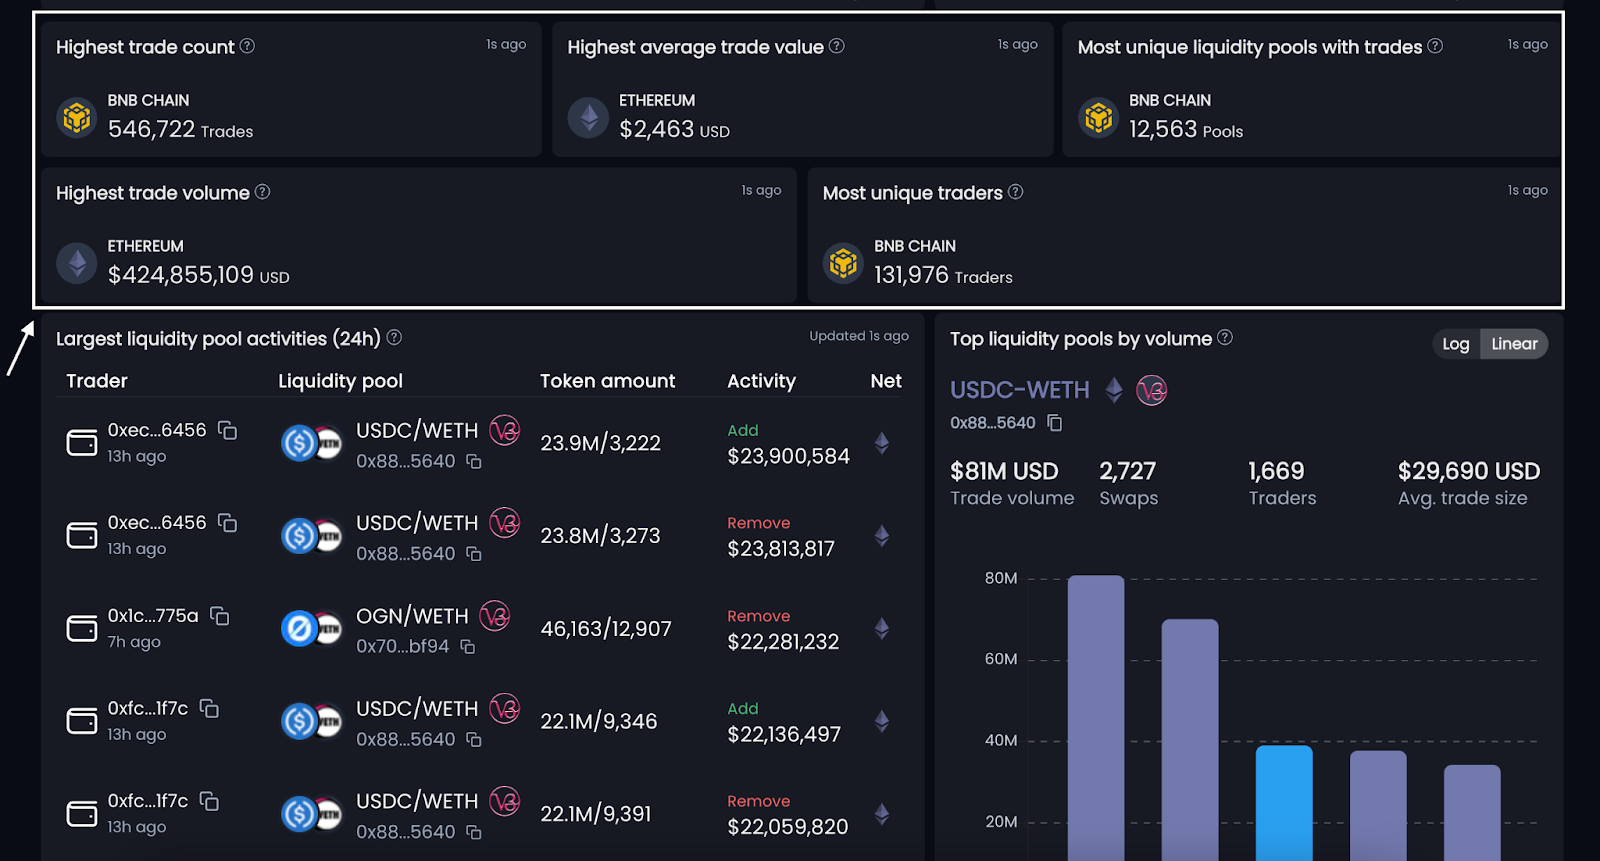
Trending network stats widgets
Liquidity pool widgets
The largest liquidity pool activities widget shows stats about the individual liquidity pools. This data is sorted by the largest additions or removals from liquidity pools over the past 24 hours across all the networks Blockpour tracks.
On each activity, find the wallet address that made the move, the liquidity pool in question, which DEX, token amounts, what type of activity, USD value of the move, and what network was involved.
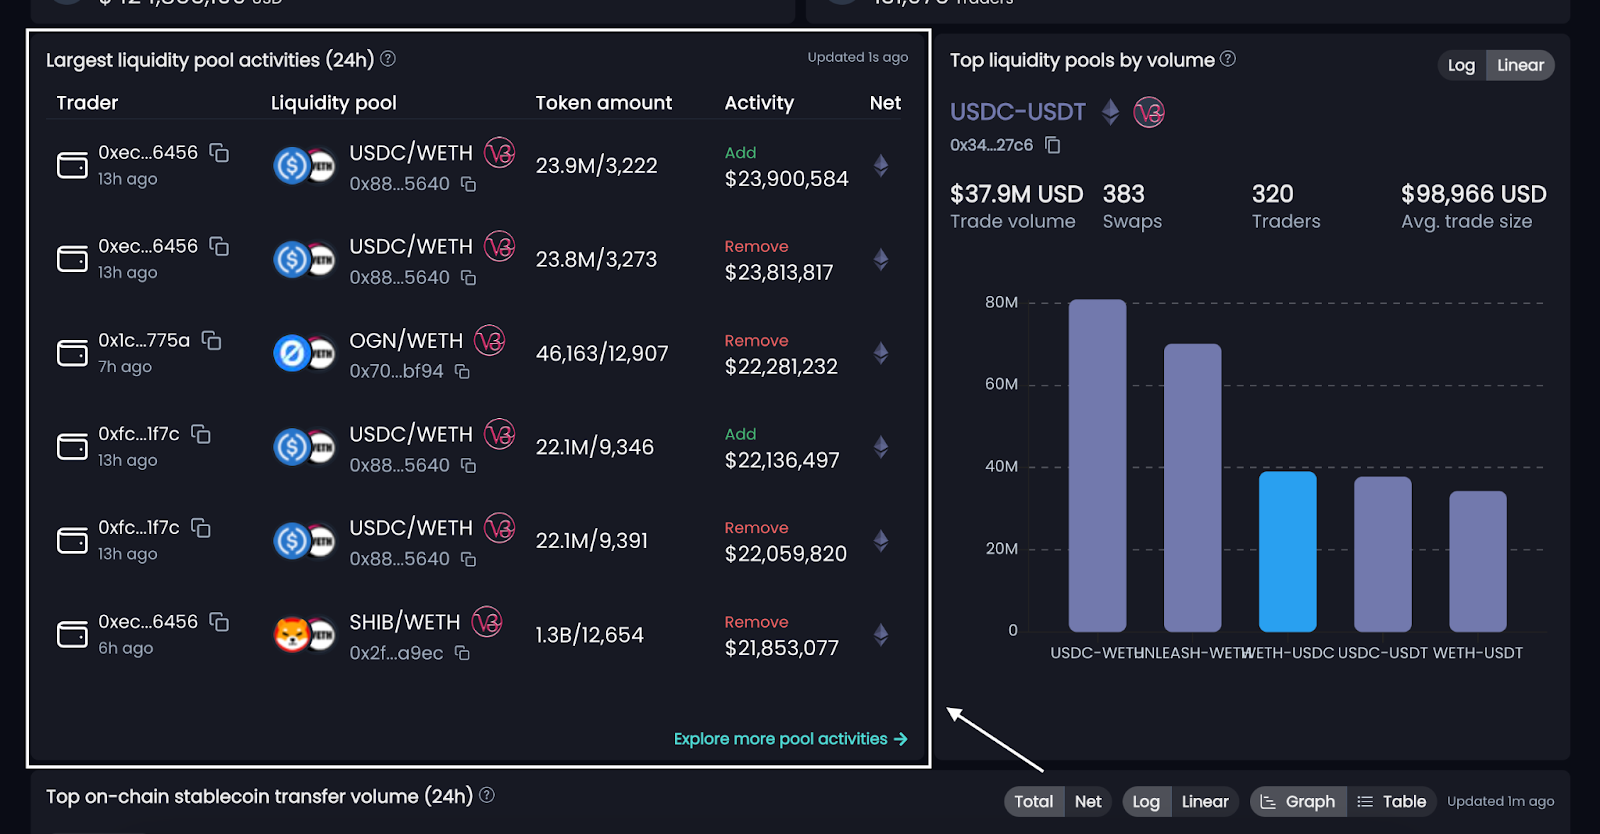
The largest liquidity pool activities widget.
Users can view the top liquidity pools over the past 24 hours across all of the networks Blockpour tracks on the top liquidity pools by volume widget. A bar chart displays colored bars coded by blockchain network and the specific liquidity pool that has handled the highest volume. Scrolling over a bar will display more detailed information about the pool such as its total trade volume, number of swaps, number of traders, and the average trade size. This specific feature enables liquidity providers to identify high-volume pools, potentially guiding them to allocate their assets more effectively.
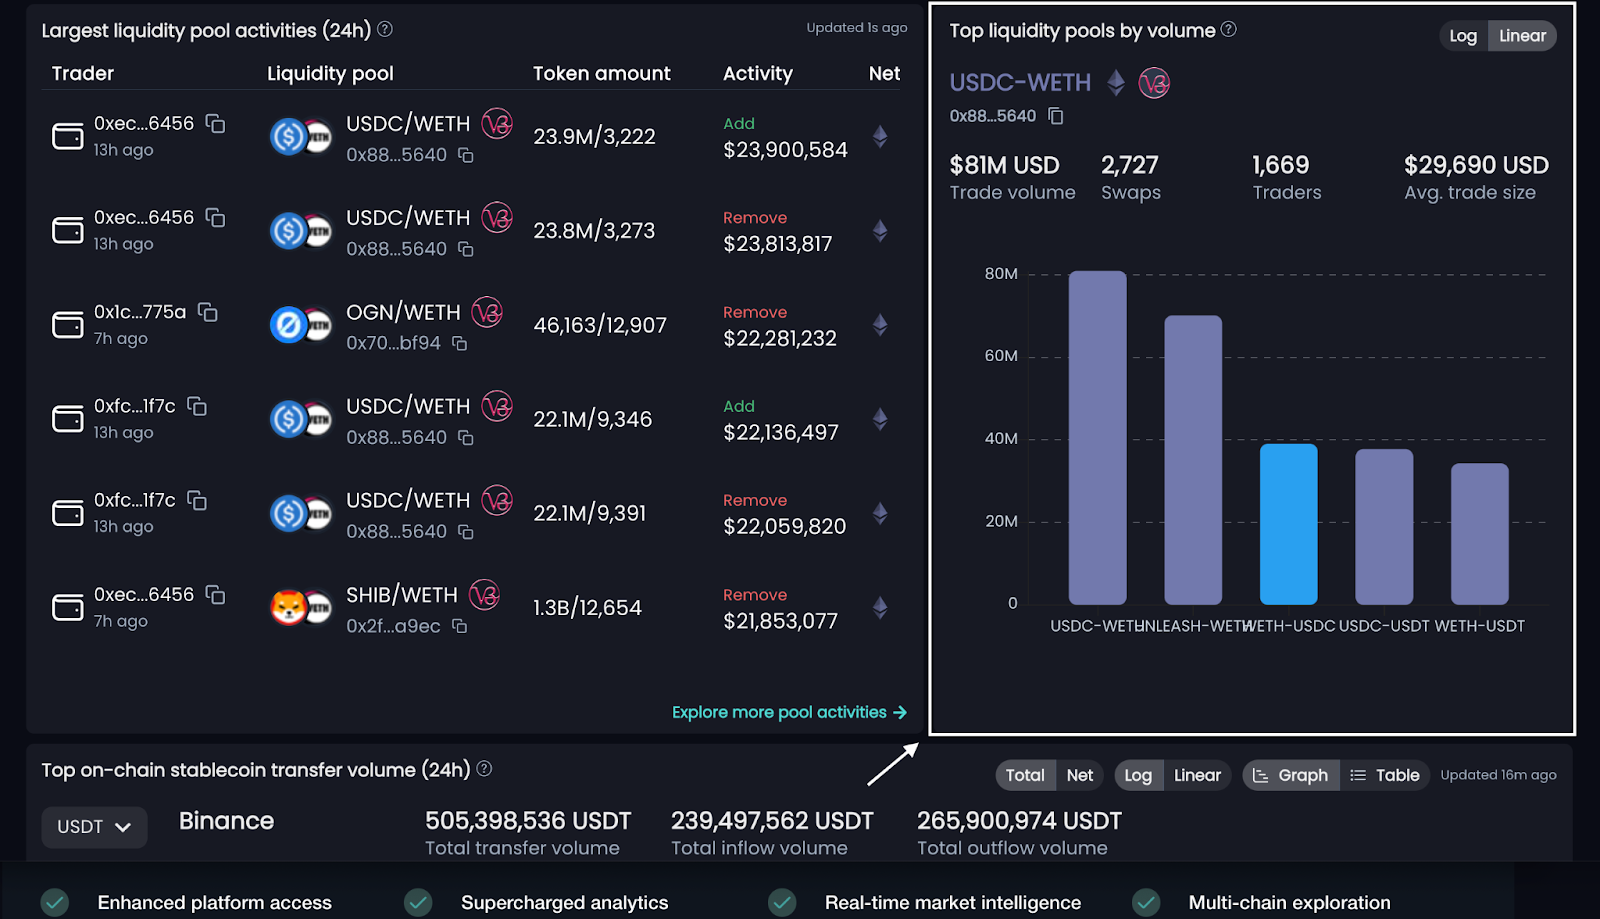
The Top liquidity pools by volume widget.
Stablecoin widgets
Blockpour now offers deep insights into the movements of stablecoins on-chain. The top on-chain stablecoin transfer volume widget shows 24-hour data about centralized entities and their stablecoin inflows and outflows denominated in USD.
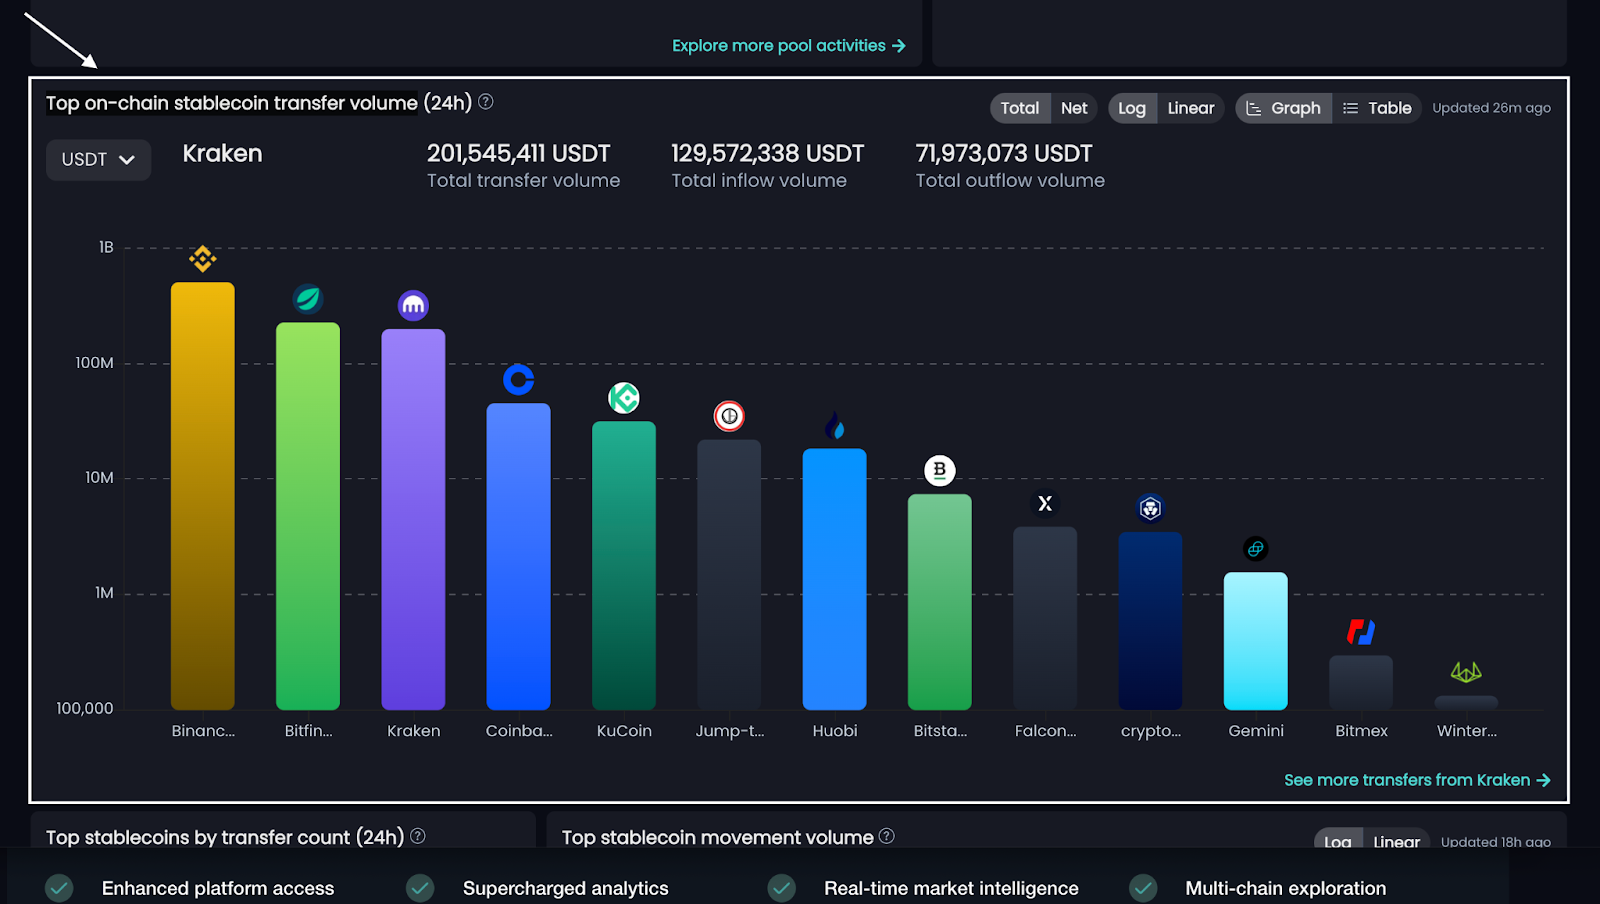
The top on-chain stablecoin transfer volume widget.
There is also the top stablecoins by transfer count widget that sorts stablecoin transfers by token, number of transfers, and the CEX through which the transfers took place. Coupled with the top stablecoin movement volume widget, users can gain valuable insight into the flow of liquidity and anticipation of market shifts.
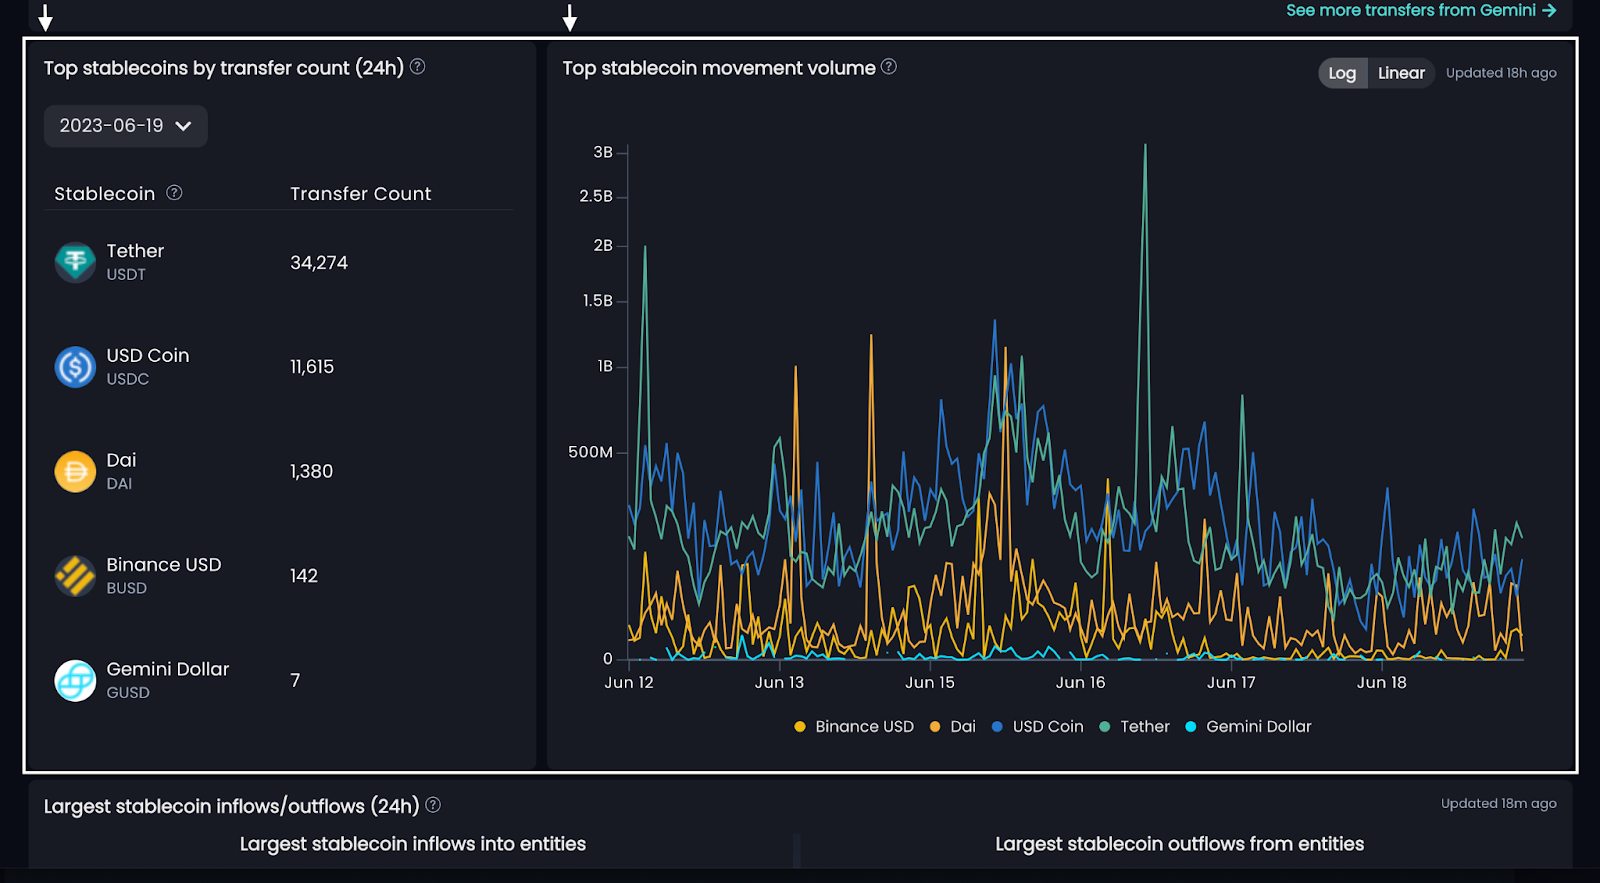
The top stablecoins by transfer count and top stablecoin movement volume widgets.
Largest inflows and outflows of stablecoins
Blockpour offers data on the largest inflows/outflows movement over the past 24 hours. This is a two-sided widget split by inflows and outflows of stablecoins. Each side shows what entity or wallet address a transfer originated from, the number of tokens transferred, where they went to, and on what network the transfer took place. A trader can leverage this data to identify significant asset movements, potentially indicating big market moves, enabling them to adjust their trading strategy accordingly.
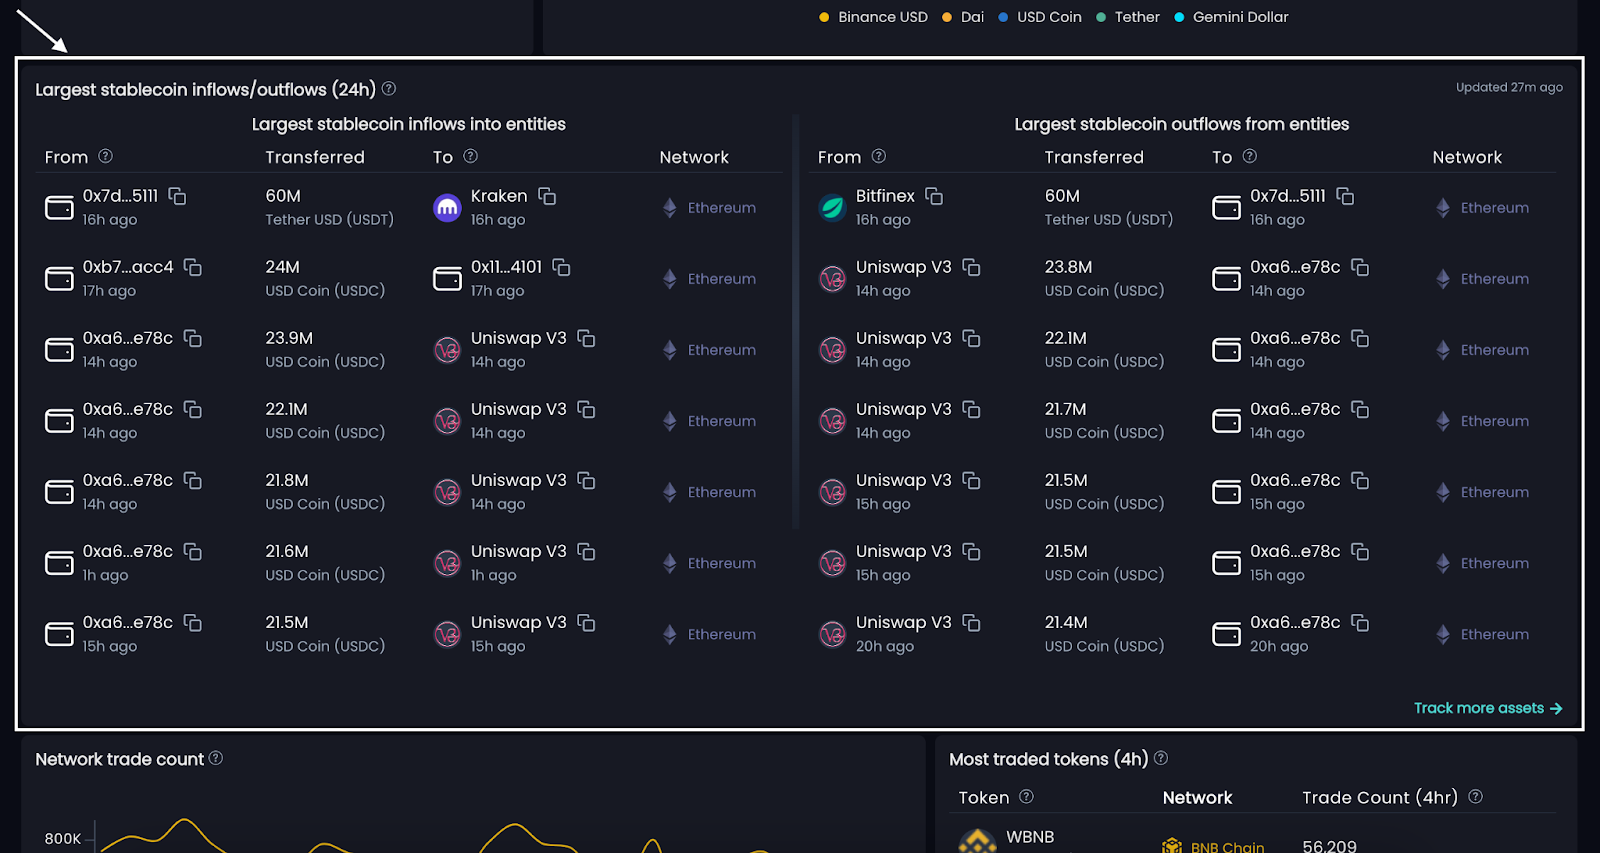
The largest inflows and outflows of stablecoins widget.
Find Network Trade Count and the Most-traded tokens
The classic network trade count widget has been kept largely unchanged. It is still a line chart displaying fluctuations in trade count with lines color-coded by network. Similar to the former trending tokens feature, the new most traded tokens widget sorts the top tend tokens by trade count over the past 24 hours.
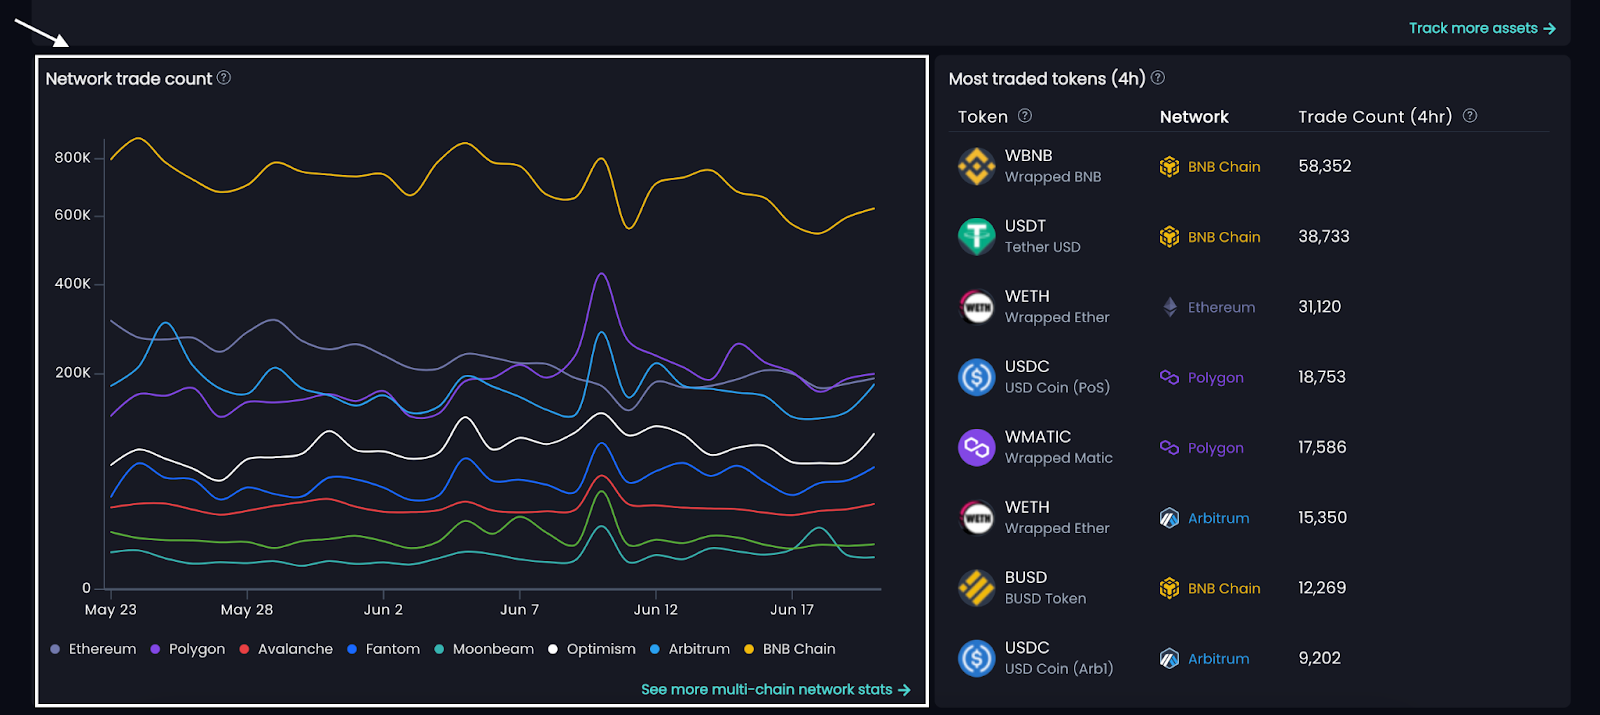
The network trade count and most traded tokens widgets.
Finally, the most traded tokens widget expands on the classic largest trades feature. It now displays the largest trades over the past 24 hours in descending order. From the left, each trade shows the trader’s address that executed the trade (which can be copied by clicking it), the liquidity pool used, the amount of tokens traded, the network uses, the total pool volume and liquidity, and the transaction ID, which users can click to be sent to the respective block explorer or copied.
This feature provides traders with the ability to monitor and analyze major market movements, helping them to identify potential significant trading trends or whale activities.
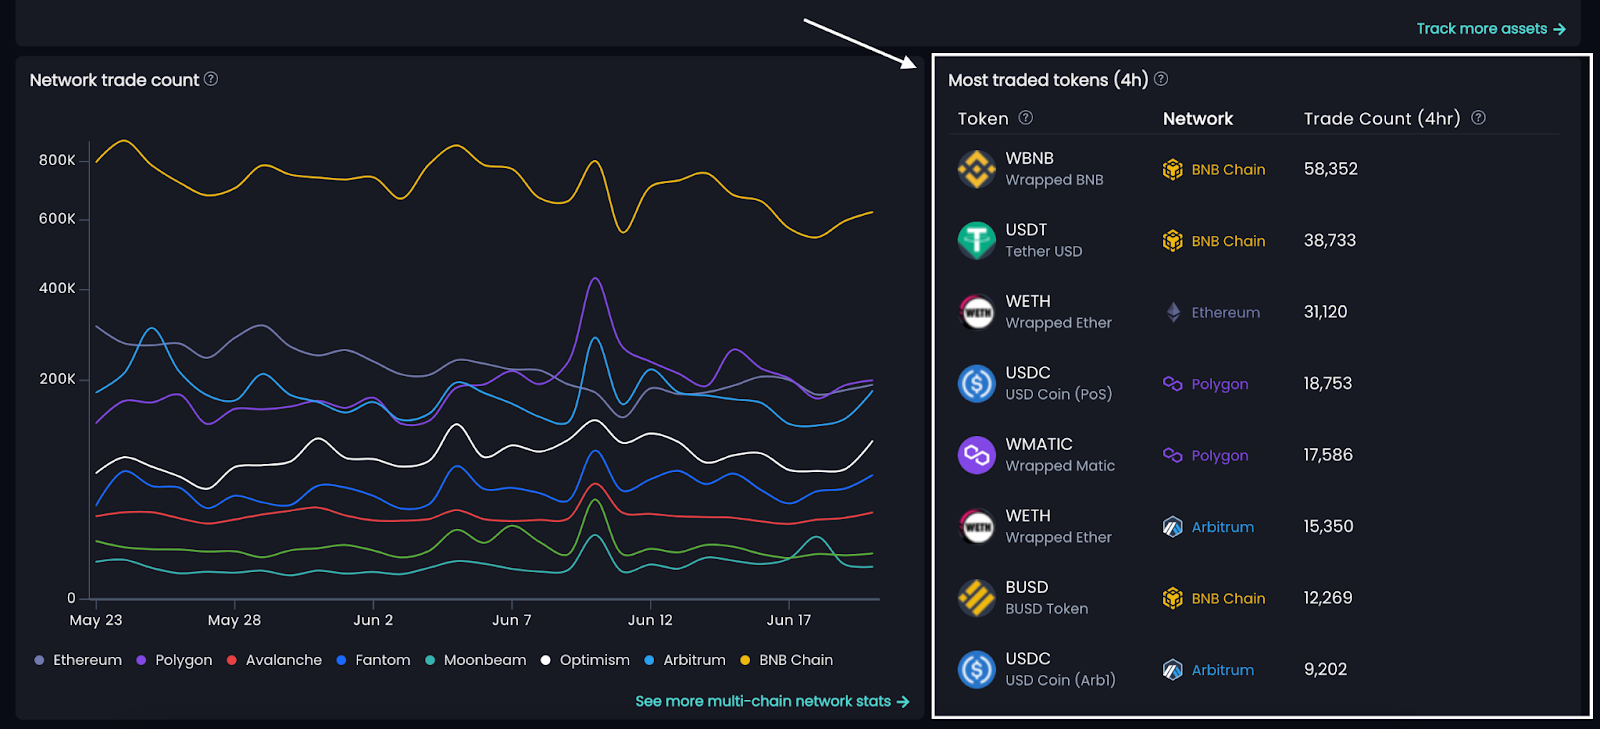
The most traded tokens widget on Blockpour.
Locating the Alpha
This updated homepage UI on the app is absolutely packed with opportunities to discover alpha in the markets. Combining any number of the different widgets can help users determine emerging or ongoing trends by network, token type, and CEX.
Tracking stablecoin movements between entities and CEXes can reveal the short-term future of the market, and knowing what CEX they flow to can suggest changes in CEX dominance based on what stablecoin is most prominently used at the most active CEXes.
Traders can pinpoint with certainty which altcoin or low market cap tokens are being traded most and where, so they can then begin strategizing arbitrage opportunities.
Blockpour 2.0 provides significant upgrades for data-hungry DeFi participants with its updated homepage UI, through its wide array of customizable widgets and powerful tools. With enhanced insights into network statistics, top tokens, liquidity pools, stablecoin movements, and more, Blockpour 2.0 empowers users to extract valuable alpha and navigate the Web3 space with confidence. Explore the new UI and unlock the potential of Blockpour today here.
Conclusion
Blockpour’s new Transfer Flows feature, combined with its intuitive multi-chain dashboards allow users to seamlessly navigate through complicated crypto data in a way unique to the ecosystem. To explore the Transfer Flows feature and many more, visit Blockpour today.
About Blockpour
Blockpour is a technology firm specializing in Web3 data and analytics, offering individuals and businesses indispensable data and tools to navigate the dynamic on-chain universe while bridging seamlessly to the off-chain world.
Through our real-time and historical multi-chain data feeds, businesses and traders can fully unlock the power of blockchain data to inform their strategies, optimize operational efficiency, and drive top-line growth.
To learn more about Blockpour check out our website and follow us on Twitter or LinkedIn. For sales or inquiries about the API, contact [email protected].
Disclaimer:
The above article is for informational purposes only and is not financial advice. Blockpour is a data aggregation and analytics platform only and does not provide financial advice or services of any kind.


Permalink