

In our latest Blockpour On-Chain to Inbox newsletter, we take a close look at the metrics surrounding the crash in prices of major tokens across the entire multi-chain ecosystem. Despite that price action, we saw massive volatility in on-chain metrics.
The second part of our newsletter features an interview with a lawyer who has plenty of experience in bankruptcies. He shared his thoughts on how founders of some of the biggest companies in crypto collapsed over the past year and a half, and what lessons the industry can learn from their mistakes.
Catch up on all these trends and follow along with our data on Blockpour’s On-Chain to Inbox Newsletter!
Table of Contents
What’s Happening In Crypto
The past two weeks were marked with a sudden increase in volatility across the markets which led to a sudden price crash on $BTC and other major coins. There is some disagreement about the cause of the volatility, but some analysts point to SpaceX apparently selling some $BTC as the main cause.
$PEPE token transfers from the team and a reduction in the number of signatures on the multi-sig wallet have led to a major 15% drop in price. Read through some of the biggest headlines from the industry to get yourself geared up for this sixth edition of the On-Chain to Inbox newsletter!
- Weird PEPE Transfers Spook Crypto Investors and Prompt Meme Coin's 15% Plunge — Coindesk
- India makes suggestions for G20 crypto roadmap — Cointelegraph
- Tornado Cash crypto firm founders indicted for allegedly laundering money for North Korean hackers — CNN
- Mastercard and Crypto Exchange Binance End Card Partnership — WSJ
- Australian exchange enlists PayPal as banks ‘close ranks’ against crypto — Cointelegraph
Who Ordered the Dip?
Over the past two weeks, the flat, seemingly dormant crypto markets awoke with more volatility than in the past several months. Prices dropped sharply at two separate times nearly a week apart while several networks that Blockpour tracks saw an explosion in activity. Let’s run down the price action and then view the underlying network activity with Network Pulse.
Major Network Token Price
$WETH is by far the biggest volatile token tracked by Blockpour with the most cross-chain liquidity ($2.5B), highest average volume which approaches $1B daily, and routinely leads all tokens in daily trade count, which can reach over 40,000 on some days. This wrapped version of $ETH will be used as the main example.
The price chart over the past two weeks tells a story worth at least a thousand words. $WETH price dropped sharply twice in this two-week period from August 12 to August 24. The first dagger was by far the most significant and may have been caused by reports that Elon Musk’s SpaceX sold at least a portion of the Bitcoin that the firm had held since about 2021. A report from Fortune refutes the idea that SpaceX had anything to do with the crash, but many other pundits differ.
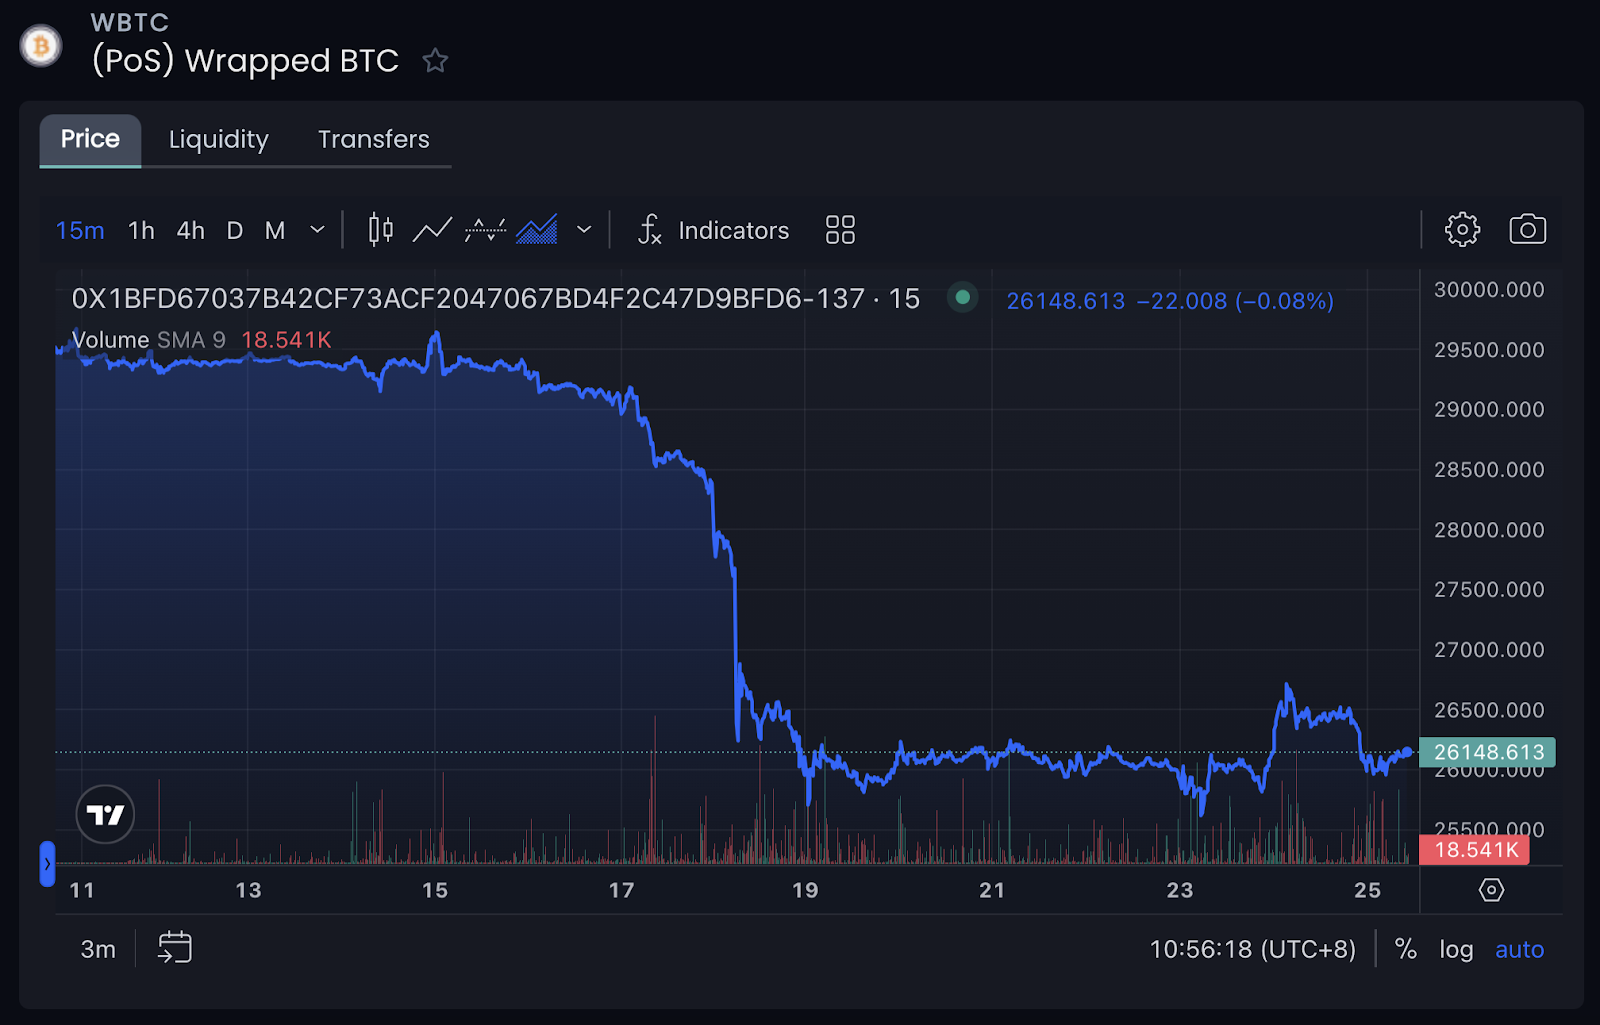
As Bitcoin price lurches upward or downward in any significant way, most other network tokens move in the same direction due to a number of factors including expanding and retracting liquidity and risk tolerances by individuals. In this case, Ethereum followed Bitcoin’s movement closely. Compare the above chart of $WBTC, the wrapped ERC-20 token of $BTC with the below chart of $WETH.
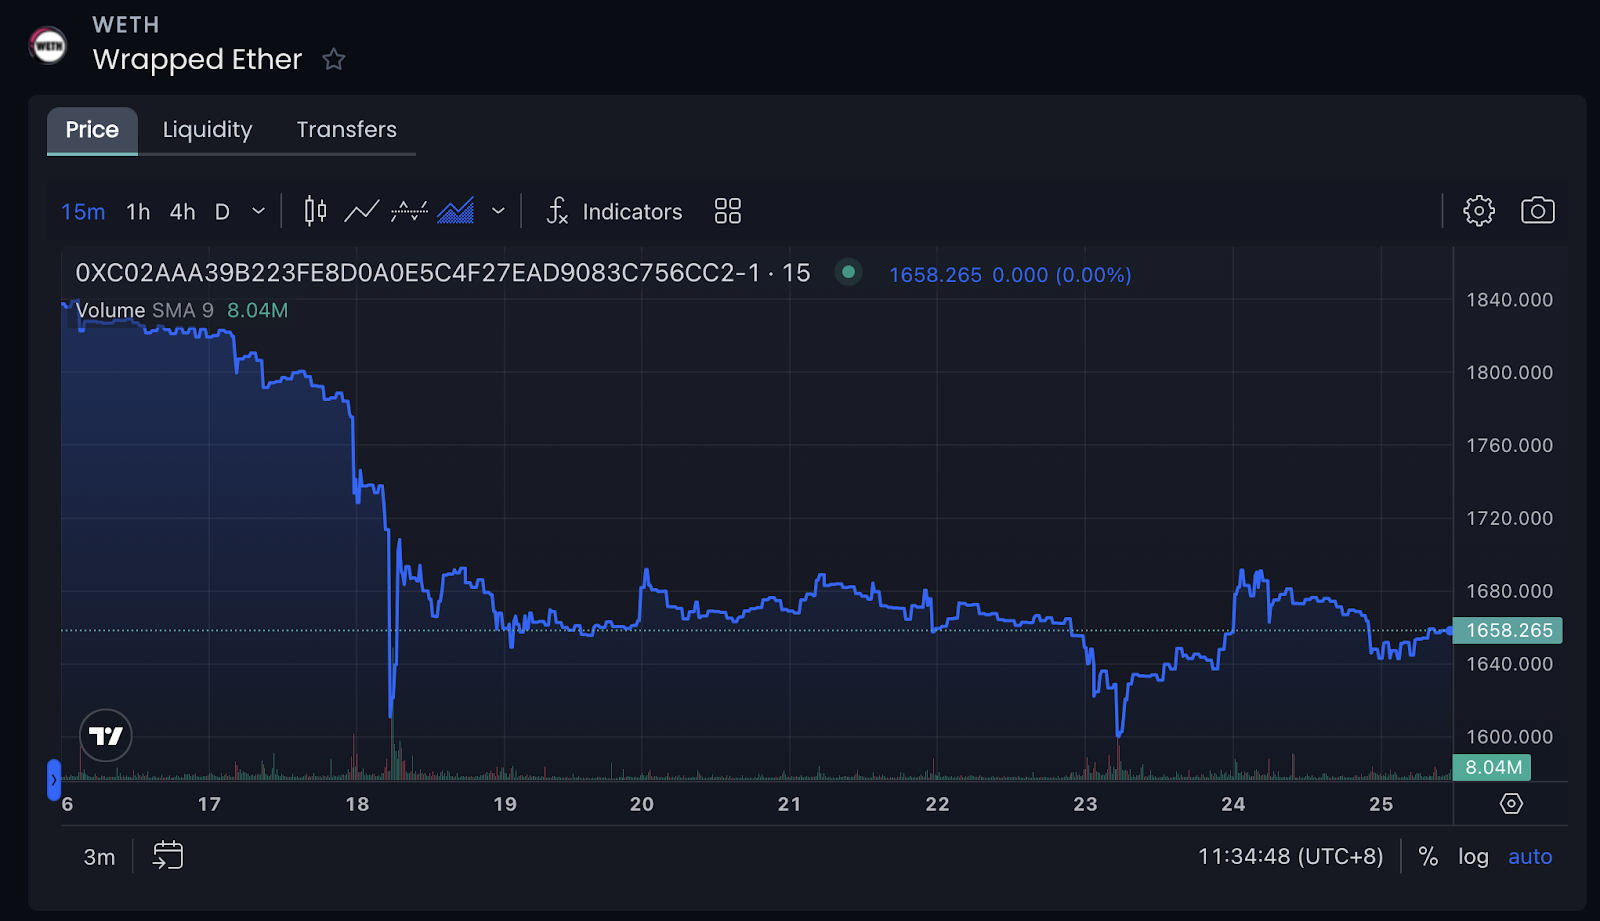
From the 11th through the 15th, $WETH prices remained fairly stable around $1,850. However, starting early on the 16th, a noticeable downward trend began, followed by a nearly vertical spike down marking an 11.5% fall to an on-chain low of $1,637 on the 18th. The price drop also led to an 8% drop in on-chain liquidity for the token to $2.2B on Uniswap V2 and V3.
Price bounced off of that low point and recovered to the $1,660 range for several days. The crabbing continued - or so the market would expect.
Leading up to this volatility, prices had been locked in a tight range between about $1,820 and $1,880 for a month or more. This frustrating crab market surely whipsawed hopeful leveraged traders and put to sleep sidelined stablecoin holders.
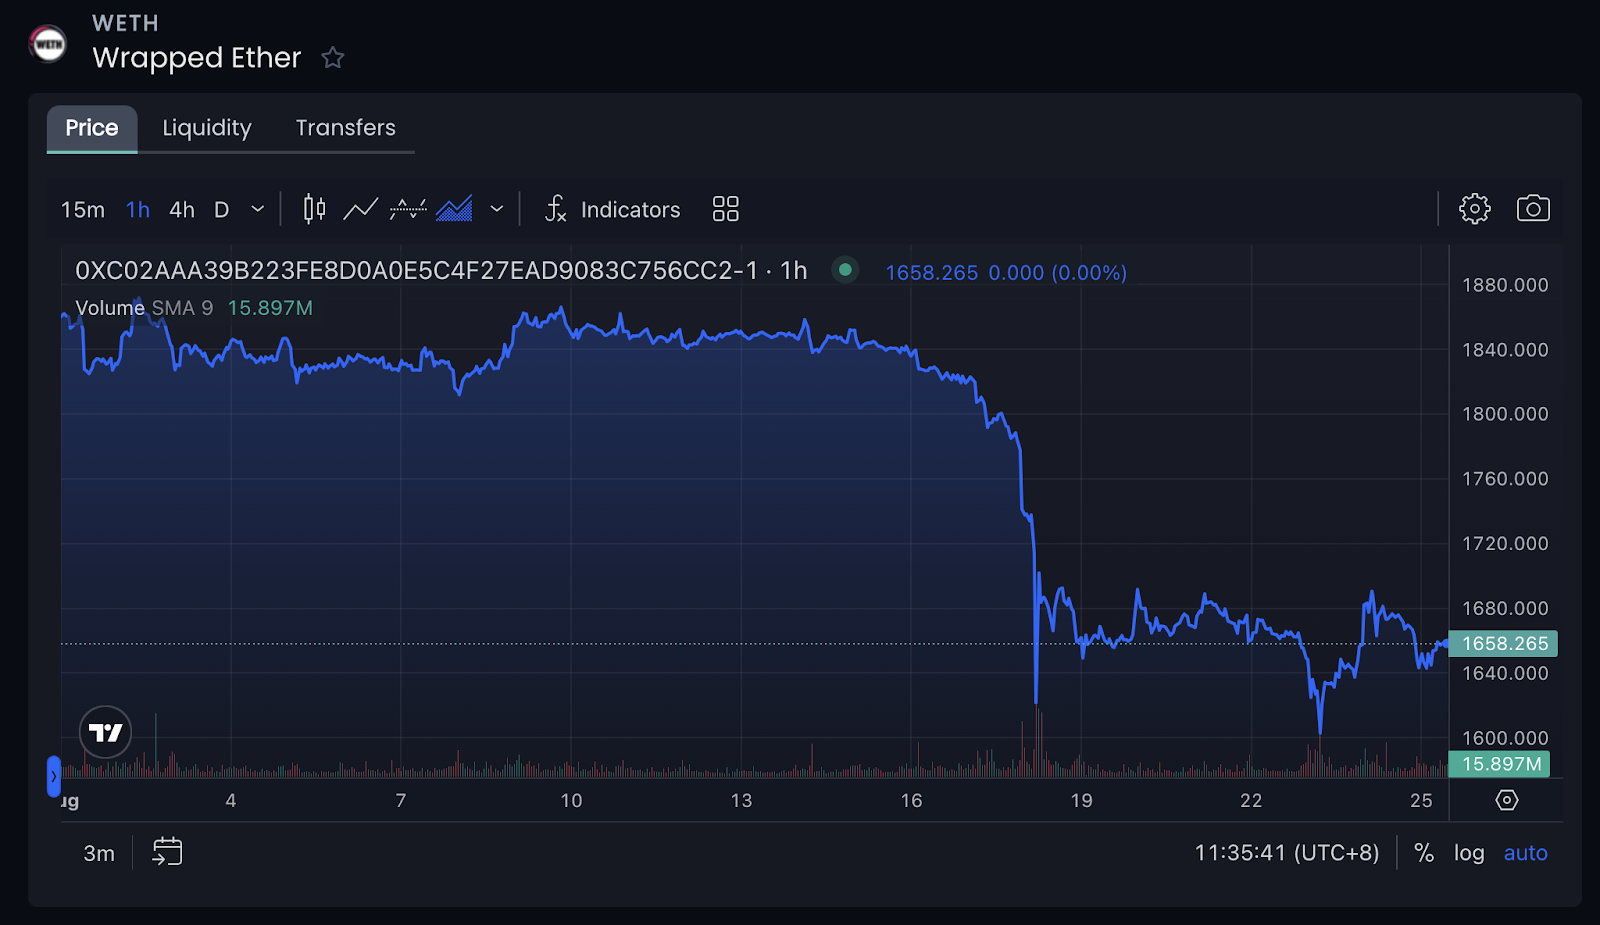
By the 22nd, volatility would increase again as $WETH price fell a further 3.3% to $1,610, then bounced higher than its previous recovery to a high of $1,687. As of the time of writing, $WETH price is hovering around $1,650.
With the close of the week rapidly approaching, it is anyone’s guess if the market ends with a Friday narrative dump or retreats back into crab mode.
Evidence of Slurping Detected
Several on-chain metrics indicated that something was certainly brewing in the week leading up to the big wave of activity. On the 12th and 13th, trade volume, the number of unique pools with trades, and average trade size each reached or nearly matched two-week lows on Ethereum , Arbitrum, and BNB Chain. These networks are the most active that Blockpour tracks.
However, after the 13th, each of those metrics began an upward trend especially on Arbitrum and Ethereum. The bar charts pertaining to trade volume and average trade size illustrate the trajectory of network activity the best.
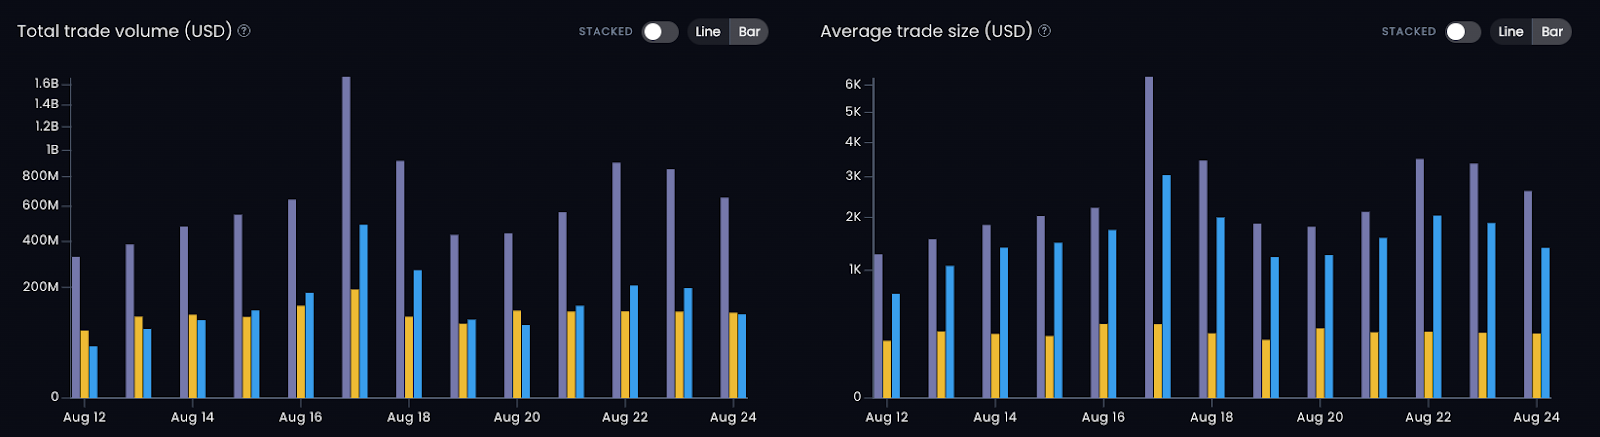
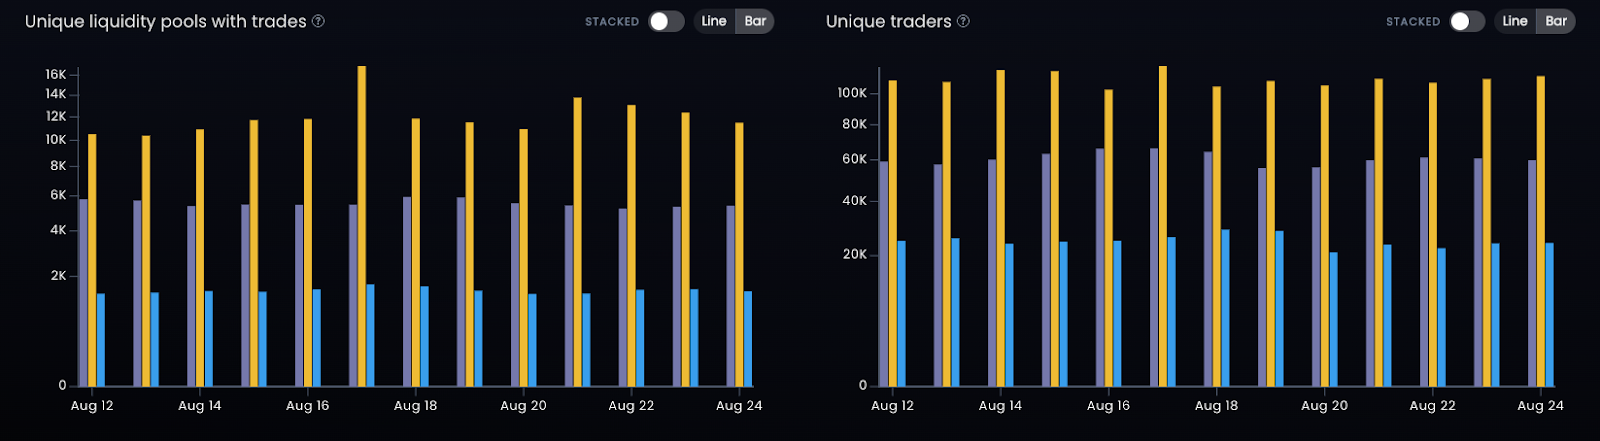
On the 17th and 18th, volume, average trade size, trade counts, unique pools traded on, and unique trader counts all hit two-week highs, as would be expected from the concurrent sell-off. Ethereum led volume ($1.7B) and average trade size ($6,321) values. BNB Chain led unique pools traded (16,955), unique trader count (119,817), and trade count (592,469) values. This is a potential indication that while prices were falling, investors impatiently exited their positions and possibly opened new ones on the fly to take advantage of the opportunities created by the volatility spike.
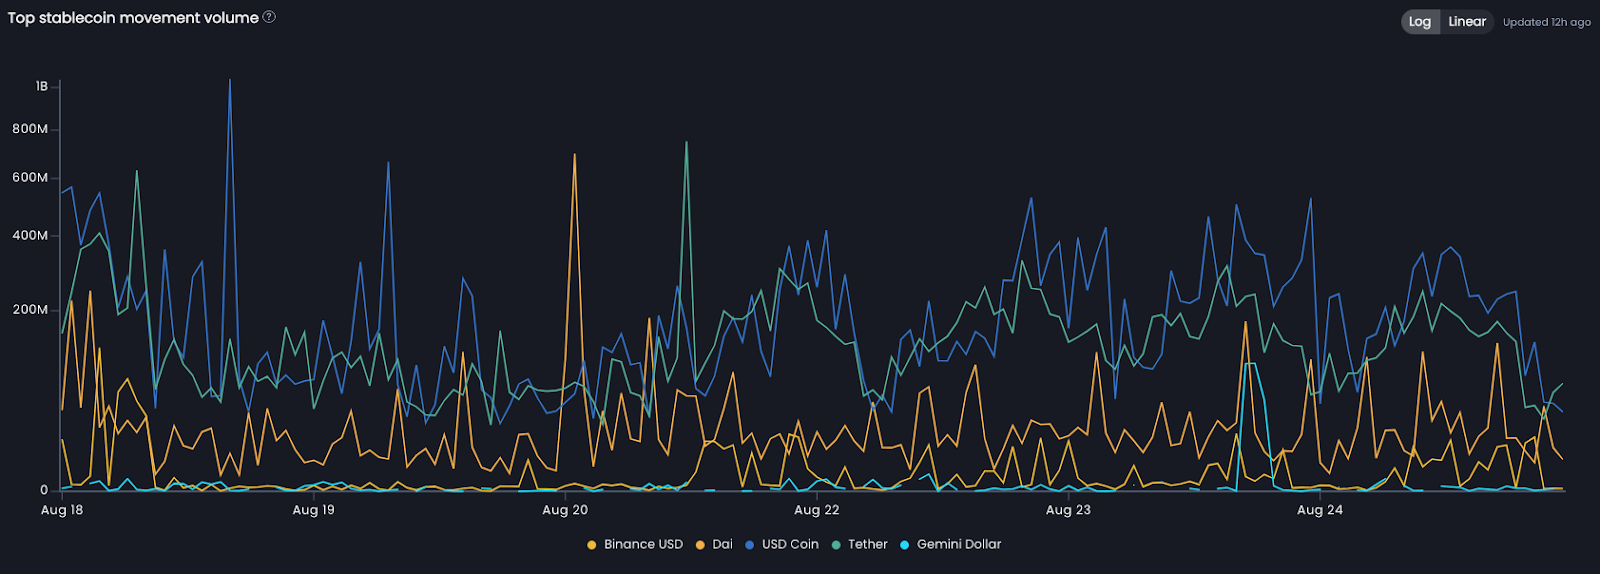
Stablecoin movement volume on Ethereum indicates that investors were moving tremendous amounts of stablecoins around during the peak of the volatility on the 18th. In an hour timespan, $3B USD worth of $DAI was moved on-chain, while a total of about $12B in $USDC volume was moved. Movement volume came down significantly in the following days, but rose again during the next wave of volatility.
As the week comes to a close, metrics are back up on several networks and have been on the rise since Sunday. It is always unclear what will happen in the future, but a similar pattern can be observed over the past few days to what happened two weeks ago leading up to the big spike in volatility. Previous patterns are not guaranteed to repeat, even if they are referred to as deja vu markets. Traders are urged to do their own research by using the Blockpour platform with an Alpha Pro subscription to have more access to data to perform that research!
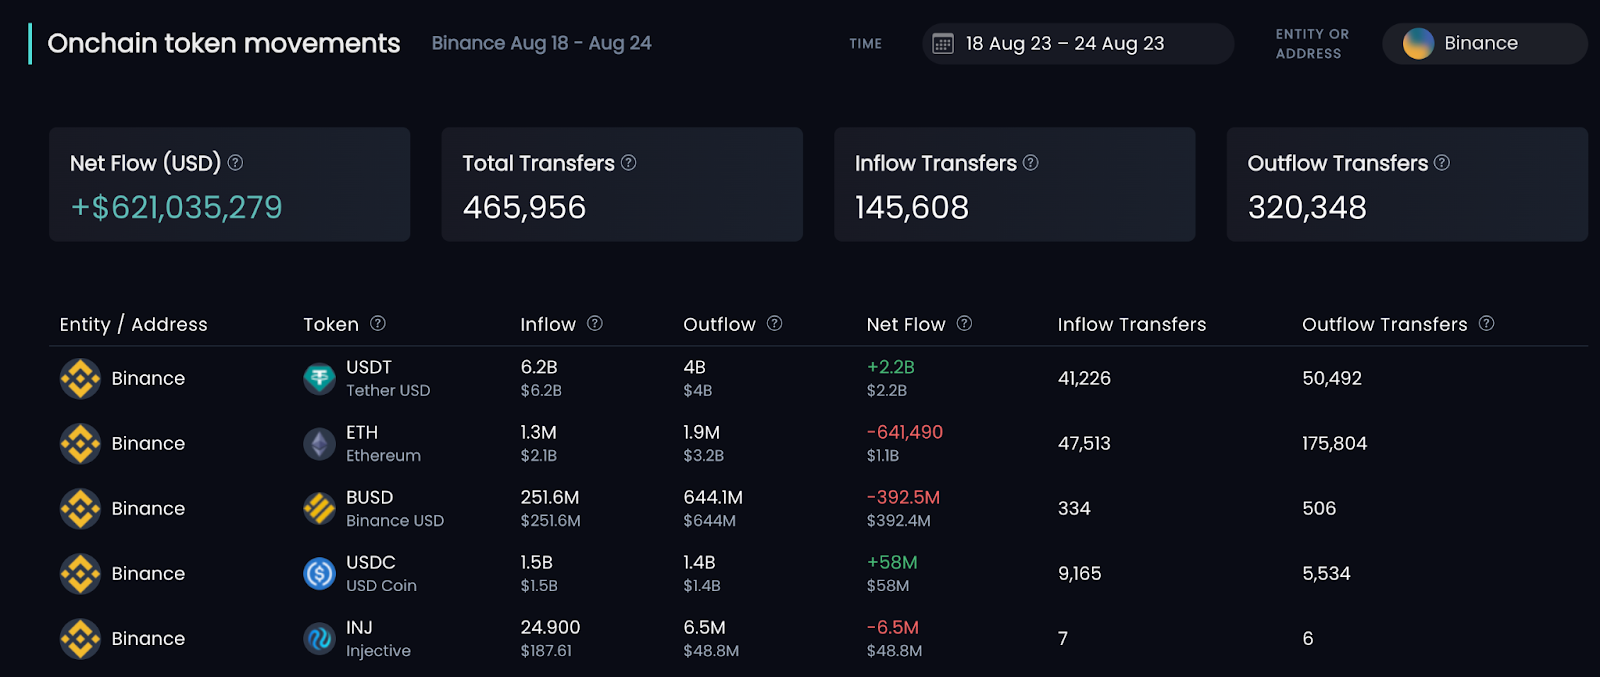
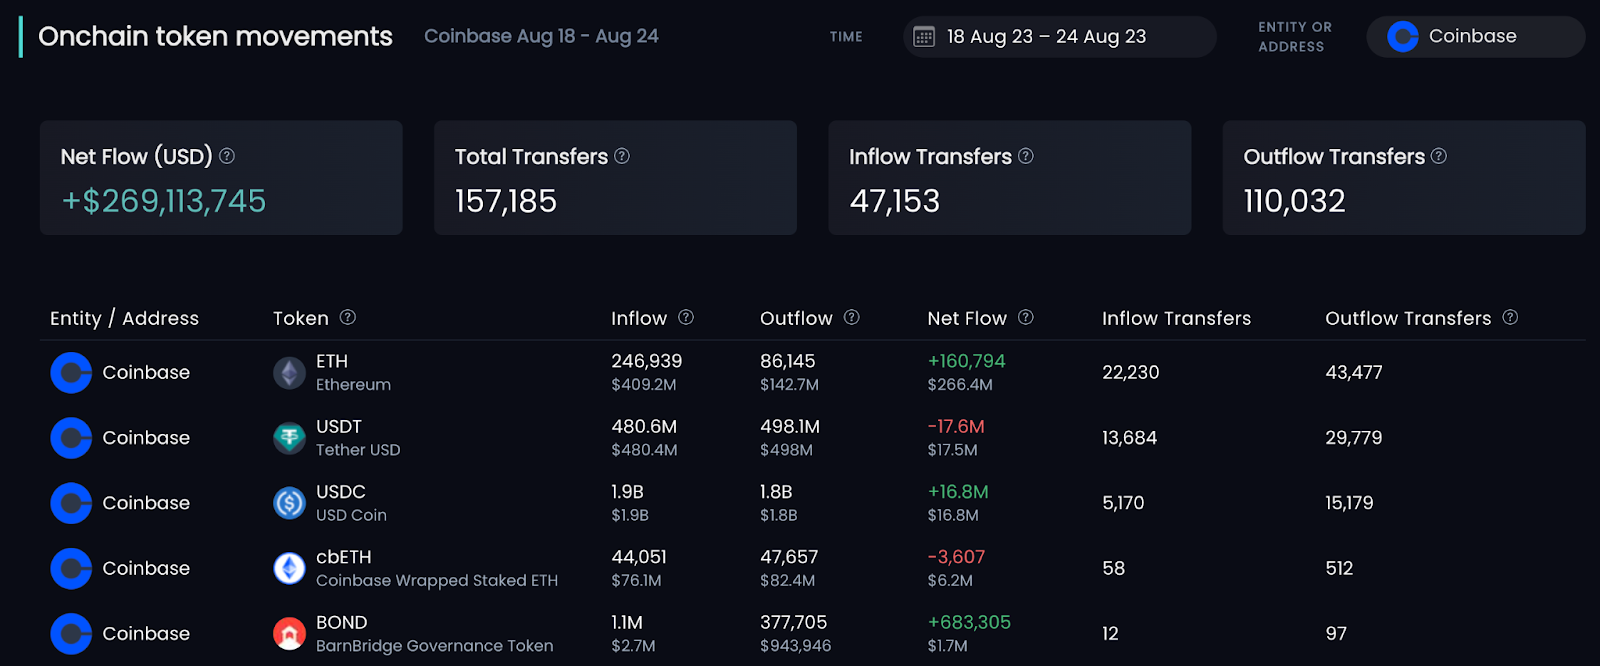
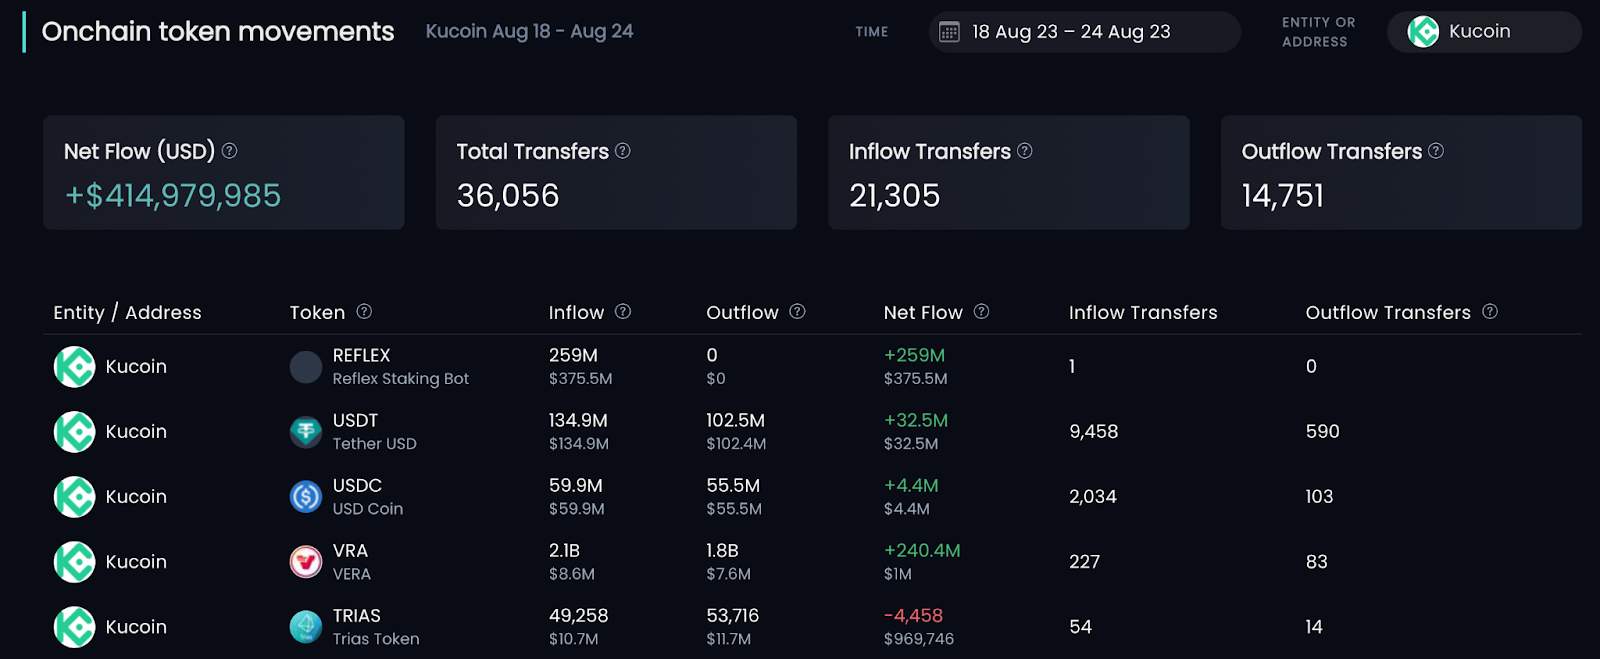
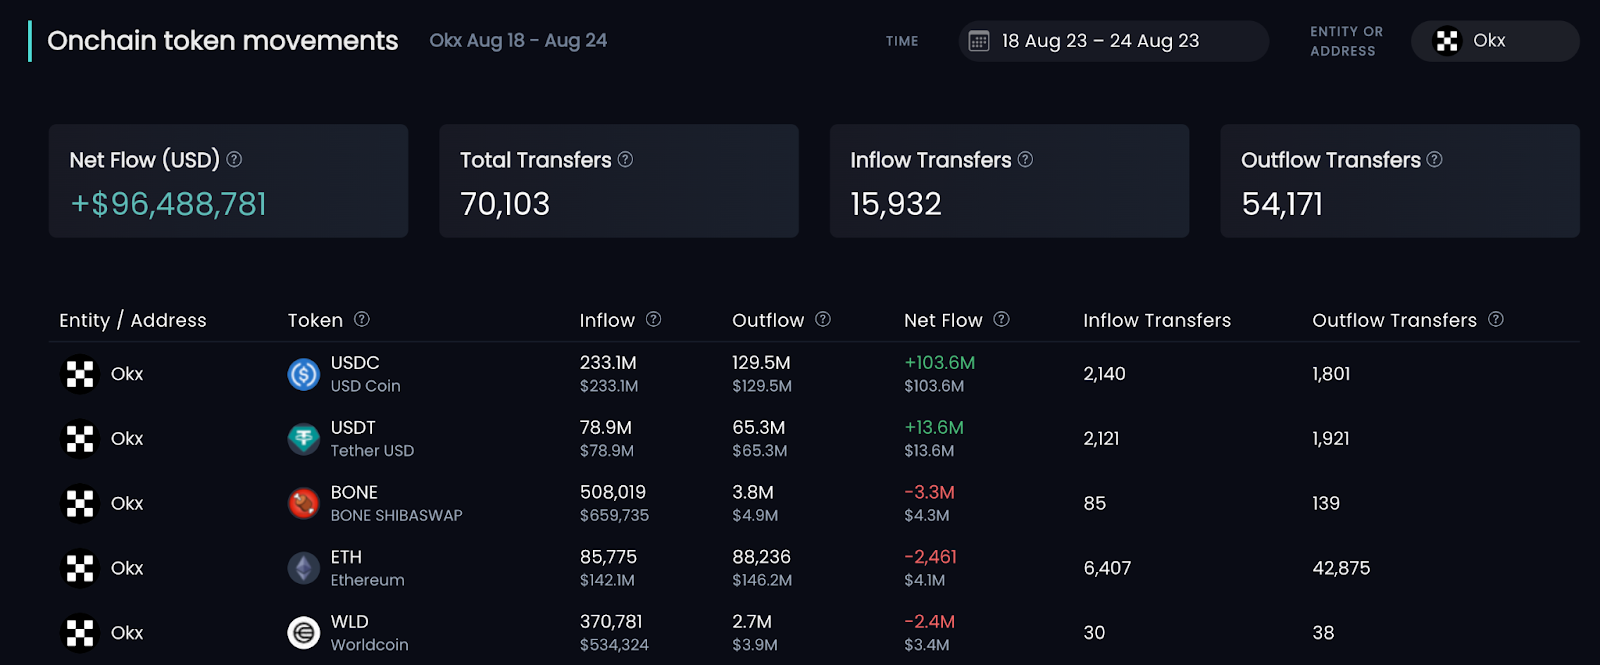
Let’s Talk About CEX: The top ERC-20 tokens transferred at centralized exchanges
This section reviews the ERC-20 token transfer flow trends from the largest centralized exchanges from August 18-24, such as Binance, Coinbase, OKX, and Kucoin.
Conclusion
This is not the end of the newsletter! We are excited to be featuring an interview with Wassie Lawyer, YK, in the second part of the newsletter. Please read How to Avoid Icarus's Fate to get some tips on how founders can stay out of bankruptcy and worse trouble in the next bull market!
About Blockpour
Blockpour is a technology firm specializing in Web3 data and analytics, offering individuals and businesses indispensable data and tools to navigate the dynamic on-chain universe while bridging seamlessly to the off-chain world.
Through our real-time and historical multi-chain data feeds, businesses and traders can fully unlock the power of blockchain data to inform their strategies, optimize operational efficiency, and drive top-line growth.
To learn more about Blockpour check out our website and follow us on Twitter or LinkedIn. For sales or inquiries about the API, contact [email protected].
Disclaimer
The above article is for informational purposes only and is not financial advice. Blockpour is a data aggregation and analytics platform only and does not provide financial advice or services of any kind.